We focus on Gold, Oil, Silver, Index & Sector ETFs. When following our technical analysis and proven ETF trading strategy, trades become very clear and simple to execute
Gold's recovery from extended further to as high as 1218.5 last week before turning sideway. Further rise remains in favor as long as 1197.3 minor support holds and gold would possibly target a retest on 1249.7 high. On the downside, however, below 1197.3 will indicate that recovery has completed and will flip intraday bias back to the downside for 1166 support and below.
In the bigger picture, while the fall from 1249.7 is deep, gold is still holding on to 1170.7 cluster support as well as 55 days EMA (now at 1170.2). Hence, there is no change in the bullish view yet and the long term up trend is still in favor to continue after completing the current pull back. Break of 1249.7 will target 100% projection of 931.3 to 1227.5 from 1044.5 at 1340 next. However, note that sustained trading below 55 EMA will opens up a few bearish possibilities. The least bearish case is that fall from 1249.7 is the third leg of the three wave consolidation from 1227.5 and would target a retest on 1044.5 support next.
In the long term picture, rise from 681 is treated as resumption of the long term up trend from 1999 low of 253 after interim consolidation from 1033.9 has completed in form of an expanding triangle. Next long term target is 100% projection of 253 to 1033.9 from 681 at 1462 level. We'll hold on to the bullish view as long as 1044.5 key support holds.....Comex Gold Continuous Contract 4 Hours Chart.
David Morgan, founder of Silver-Investor.com, says gold prices could stay in a tight trading range for while but that longer term prices will resume their upward trend.
It’s been an exciting week for traders as volatility levels are through the roof and the broad market is moving up and down like a yoyo. You cannot take your eyes off the screen if you have a large amount of money invested as you can quickly find yourself with a large profit or loss in the matter of minutes....
Although we have seen stocks jump around the past few days precious metals have held strong with very little volatility. This is because of the economic fears looming for the US and other countries of possible financial collapse. This fear is helping to boost gold and silver prices because they are seen as the safe haven. Also we are seeing money move in the US dollar because the country is still seen as a leader in many ways helping to boost the US dollar.
Below are a couple charts on Gold and Silver ETF’s showing the end of last years rally and the correction in prices which are now looking to setting up for another leg higher.
Gold Futures Price – 60 Minute Day Trading Chart
Gold has been showing some very bullish price action the past week forming several mini bull flags with confirming volume levels. I think we should see gold pop another $5-10 bucks in the very near future if not continue higher for several days.
SLV – Silver ETF Trading Vehicle – Daily Chart
Silver formed much of the same patterns as gold but with much more volatility. Also silver has yet to break the 2009 high which is surprising but with a large part of silver being use for industrial purposes it does make sense as the economy is not as strong as it was thought to be in 2009. Silver carries much more risk when trading because it has more random moves and increased volatility.
Mid-Week Precious Metals Trading Conclusion:
In short, gold and silver are in an uptrend and looking strong. Both are currently trading at short term resistance levels on the daily chart which has caused them to stop moving up today (Wednesday May 26th) but on an intraday basis they look solid and could break though these resistance levels.
That being said buying way up here adds a lot more risk because a good chunk of the move has already been made and if prices do roll over and start heading back down the next support level is several percentage points away for placing a protective stop with the proper amount of wiggle room.
If Trading Gold, Silver and Index Futures and ETFs interest you, check out Chris Vermeulen's trading services at The Gold and Oil Guy.com
After exiting all long positions at 1217.72 on 5/18, we reinstated long positions seven days later on 5/25 at 1196.57.
As many of you know who watch my videos, we use our weekly "Trade Triangles" for trend direction and our daily "Trade Triangles" for timing entry and exit points. It was those daily "Trade Triangles" that flashed a buy signal on 5/25.
Given the chaotic state of the world and all the cross currents that are running in the banking system, we would not be surprised to see gold once again climb up and challenge the $1,250 level. All of our "Trade Triangles" are green and 100% to the upside. This indicates that a strong trend is once again in place for the gold market.
The video is available for viewing now and there is no charge or registration requirement.
Gold traders are always a very vocal segment of the trading population and so we encourage you to let your voice be heard on our Trader's Blog.
The stock market topped in April which was expected from analyzing stocks and the indexes. Back in April I posted a few reports explaining how to read the charts to spot market tops. Today’s report is about identifying market bottoms. It does not get much more exciting than what we have seen in the past 2 months with the market topping in April and the May 6th mini market crash. This Thursday we saw panic selling which pushed the market below the May 6th low washing the market of weak positions.
For those of you who have been following me closely this year I am sure you have noticed trading has been a little slower than normal. This is due to the fact that the market corrected at the beginning of the year and we went long Feb 5th and again on Feb 25th. Since then the market rallied for 2 months and never provided another low risk entry point. In April the market became choppy and toppy and we eventually took a short position to ride the market down. Now were we are looking at another possible reversal to the upside.
Only a few trades this year which I know frustrates some individuals but if you step back and look at my trading strategy you will learn that we only need to trade a few trades a year to make some solid returns. I don’t know about you but I would rather trade a few times a month and live life between trades… not trade all day every day getting bug eyed in front of the computer.
Ok enough of the boring stuff let’s get into the charts....
SP500 – Stock Market Index Trading ETFs & Futures
The pullback in the broad market was expected but the mini crash on May 6th really through a wrench into things for us technical analysts. We don’t really know the truth about what happened that day… was it just a simple error or was it a planned error for the US government to take a massive short position to move something in their favor quickly to generate MASSIVE gains? It leaves us technicians hanging wondering if that was a shift in trend from up (accumulation) to down (distribution)?
My thoughts are if the crash was truly an error then we will see months if not another year of higher prices… But if it was a planned sell off with banks moving to the sidelines then we are most likely headed into another bear market. Personally it does not matter what happens as big money will be made in either direction. Problem is if we do go into another bear market then the majority of individuals will lose capital as investor’s portfolios get smaller and smaller. That will lead to a lot of depressed people…
In short, I am neutral on the stock market for the intermediate and long term. Once we have a few more months of price action only then will I have a plan for longer term investments. But on the short term time frame the market is screaming at me with extreme sentiment levels lining up on the stock market and gold.
The daily chart of the SPY – SP500 Index shows several important points which help me time market bottoms. We have prices trading at a support zone. Buyers step back into the game here and should provide a decent bounce which started Friday Morning.
Next we have the panic selling spikes from an indicator I created. Generally the day after we see panic in the market like we did on Thursday we will see a big bounce and many times a large rally.
Down at the bottom you can see my custom market cycles which are both starting to bottom. During times like this the market has a natural tendency to move higher.
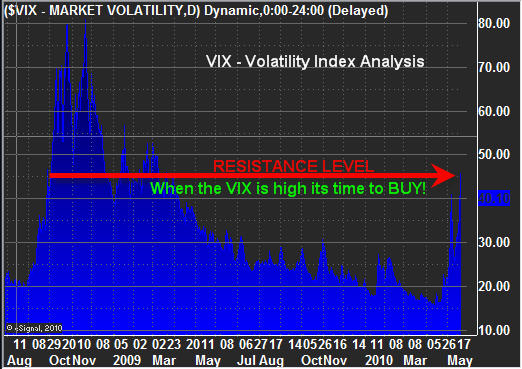
VIX – Market Volatility Daily Chart
The VIX has an old saying “When the VIX is high its time to buy, When the VIX is low, its time to go”. Simple analysis clearly shows the VIX trading high and at a resistance zone.
Put/Call Ratio – Daily Trading Chart
This chart measures the amount of put and call options traded each day. When it is trading over 1.00 then we know for every 1 call option traded (wanting the market to go up) there is 1 put option traded (wanting the market to go down). Over 1.00 is extreme and when that many people are bearish and using leverage to profit from a drop in price then in my opinion it means everyone has already sold and the selling pressure is about to end.
Actually if you go back in time and review SP500 and this ratio you will notice 2-3 days after this ratio reaches 1.00 or higher the market bounces/bottoms.
NYSE Advance/Decline Line for Equities – Daily Chart
This chart shows us how many stocks are advancing or declining on any given day. When extremes are reached look for a short term bounce or bottom 1-3 days following.
How to Identify Stock Market Bottoms with Simple Analysis:
In short, I feel the market is forming a bottom here. How big of a rally will we get? I don’t know because of the mixed signals from the May 6th EXTREME heavy volume selling session. As usual I focus on trading with the trend, trading the low risk setups and I manage my money/positions scaling in and out of those positions as I see fit.
George Gero, vice president of global futures at RBC Capital Markets, says gold prices should be lower today on options expiration, but geopolitical and financial worries are supporting the precious metal.
Gold is gaining in popularity with the online trading community, and whenever we write about it, or produce a video featuring this precious metal, unsurprisingly, it also tends to generate the most passion of any market that we cover. With gold making new highs recently, we thought it would be timely to put together a video showing you where we are placing our short term stops. The video is about 90 seconds long and shows you in a very visual way, what we're looking at in this market.
As always the video is available for viewing now and there is no charge or registration requirement. Please feel free to comment on this video and let us know what you think about the direction of this gold market.
Last week was amazing for both gold and index traders as gold surged higher and the SP500 tested a key resistance then fell 4% in our favor. The past couple weeks with the mini market crash and Euro issues making the market extra volatile both gold and the broad market (SP500) index has been wild.
The added volatility makes trading more difficult because price patterns become less predictable and price movements are much larger increasing risk for traders.
Below are the charts & videos of what to look for in the coming days…
GLD – Gold ETF Trading
Gold continues to trend higher at an accelerated rate. Friday we saw gold pullback and test a key support level then bounced to close in the middle of the days trading range. As you can see the trend line support has become very steep and once the trend line support is broken I figure there will be a sharp drop to digest the recent rally.
SLV – Silver ETF Trading
Silver popped and tested a key resistance level from a previous high as expected. It also tested the top of its trend channel providing even more resistance. This week will be interesting as we wait to see if precious metals have a small pullback or continue to rally.
SPY – SP500 Index ETF Trading Chart
This chart clearly shows what I think is about to unfold by looking at the past market drop. Because of the mini market crash triggering everyone’s stops already I figure we have made the low and the dip we are seeing now will drift down a few more percentage points then bottom out.
ES M0 – SP500 Mini Futures Trading Setup – Pre-Drop
Below is a chart of the SP500 which we shorted or bought the SDS bear etf trading fund last week looking to profit from a falling stock market. As you can see from the chart we saw the es mini contract drift into a key pivot point on light volume. What this means is that a large group of sellers will be waiting at that price, and because volume is light we know there are not many buyers at this price level. Simple supply/demand comes into play with more sellers causing the price to stop rising and eventually force the price lower which is what we were anticipating.
The green arrows show key support levels on the 60 minute chart where 1/3 of a position should be taken of the table to lock in gains which also reduces overall risk on the trade. Once we cash in the first 1/3 of the position we move our protective stop the breakeven which is the entry point for the remaining portion of our position. This turns the trading into a winner no matter what happens allowing us to enjoy the ride…
ES M0 – SP500 Mini Futures Trading Setup – Current Price
Here is the same chart 24 hours later showing both of our profit targets triggered pocketing 2/3rds of our position for a very nice gain. Depending on the type of trading vehicle you traded there was potential to make up to 150% return in less than 24 hours.
We currently hold 1/3 of the position left with a loose stop allowing the trade to mature incase the down trend continues for several days or weeks. If not and the price rallies then our stop will get triggered for small profit on the balance of the position. Either way we win.
Stock Market ETF and Futures Trading Conclusion:
In short, the market is trading on increased volatility making it difficult to find low risk setups. At the moment we are long gold and short the SP500 with both position deep in the money. All we can do now is manage our positions to make sure we maximize our profits.
It’s been an exciting couple weeks in the market with gold now making new all time highs as money floods into this shiny safe haven. It has everyone all worked up wanting to take part or they are riding the rally up already. But the big question is when should some money be taken off the table to lock in gains and lower your overall risk during these crazy times?
Below are a few charts showing you how I see things at this time.
GLD – Gold Exchange Traded Fund The price of GLD and gold appear to be going parabolic (straight up). The tough part about this type of price action is that large moves can happen in a very short period of time. But on the flip side, when the price reverses we tend to see prices fall just as fast if not faster. Trading this type of price action carries a very high level of risk. Those chasing it up buying at these overbought market conditions is a double edge knife.
SLV – Silver Exchange Traded Fund Silver is trading similar to gold but the key difference here is that silver has not broken to a new high as of yet. The high was set in 2008 just over $20 per ounce. But from looking at the chart I think metals are ready for a breather.
HUI Index – Gold Stocks Gold stocks have yet to breakout along with silver as they both are nearing key resistance levels. With gold stocks and silver trading near resistance I figure we will see pause in the coming days as traders digest the recent strong moves up taking some money off the table incase prices get stuck under these resistance level.
SPY – SP500 Broad Market Exchange Traded Fund The broad market appears to be forming a possible short setup on the daily chart as the price continues to drift higher with declining volume. Also indexes are testing key resistance levels and the 10 period moving average. The next few days should be interesting....
Mid-Week Precious Metals and Index Exchange Traded Fund Report: In short, it looks like precious metals and the broad market could take a breather in the coming days. I’m not sure how large of a correction we will see but I do not think it will be all that big.
Gold and silver should have a quick dip with buyers stepping back in on weakness. The SP500/broad market is a little more tough to call as last weeks market crash messed things up washing out all the stops in one day instead of weeks....but we could easily see a 5% drop in the market still.
Perhaps no other market in the world elicits such emotion and passion than the world's gold market. One only has to mention gold, and theories just come out of the woodwork in regards to conspiracy, market manipulation, and a host of other less than savory subjects.
So what's a trader to do?
Regardless of how you feel about gold, this market presents some great trading opportunities that you can capitalize on using our "Trade Triangle" technology.
Now, hard core gold bugs will not subscribe to this method of trading as they prefer to buy physical gold and hold onto it or bury their bars in their backyard, and to be honest with you, there is nothing wrong with that belief.
I've been asked to update our outlook on gold, so I thought that today I would make a short video to share with you some of the points I see in the current market.
As always, our videos are free to watch and have no obligation. The only thing that we ask is that you share your views on our blog. The views can be bullish on gold or bearish on gold, the choice is yours to make.
As we all know, last weeks stock market blip/mini crash was very emotional for those of you watching or trading it live. A lot of money changed hands last week and you either lost a bundle or made a bundle…
I did send out some charts and a video on Thursday night about the market crash/recovery if you have not seen it. It’s called “Stock Market Micro Intraday Crash Shows Us Where The Safe Havens Are”.
Below are my ETF charts for the commodities and index I actively follow and trade.
GLD – Gold Bullion ETF – Daily Chart GLD is a great ETF to trade as it generates 10-20 quality low risk setups each year for subscribers. The chart clearly shows the large rally in late 2009 and the correction as it formed patterns moving from a down trend – base – and back to an uptrend.
$USD – US Dollar Index – Monthly Chart This weekly chart I think shows some serious potential for gold and silver prices. The US Dollar is now trading at a key resistance level which I think it will have a tough time moving higher. The dollar has been moving up for several months and looks ready for a pullback or at least a pause. If the dollar starts to roll over in the next few months then we should see gold and silver move substantially higher.
SLV – Silver Bullion ETF – Daily Chart Silver like gold bounced off a key support level last week as investors started to buy silver as a safe haven. Gold moved up sharply on the day of the intraday market crash while silver traded sideways for a day before joining the party. The following day investors starting buying up silver because it was lagging its big sister “yellow Gold”.
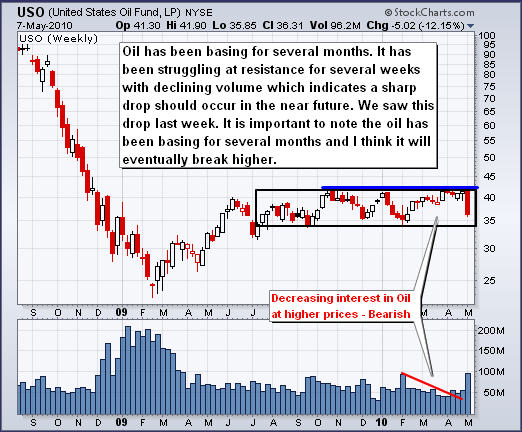
USO – Oil Fund – Daily Chart Several weeks back I posted this chart showing how volume was drying up as oil tested resistance on declining volume. This indicated to us that once/if the price started to roll over it would trigger a sharp sell off as short term traders who bought in anticipation of a breakout to the up side sold out of their positions once support was broken. This is what caused the heavy volume and sharp price drop.
SPY – SP500 INDEX Trading ETF – Daily Chart It’s tougher now to read the index charts as last weeks heavy volume market crash could be seen in two very different ways…
One – We are starting a correction and had a jump start with the human error of selling billions of dollars worth of investments instead of millions prematurely pushing pulling the market down to a level where I think it should/will test again before moving up.
OR Two – This extremely heavy sell off is just the start of what is to come....
Since the government owns the largest banks and the banks are unloading/selling massive amounts of shares calling it an error how do we know it’s not a scam for them to completely short the market in anticipation for a collapse which would make them unheard of amounts of money as the market drops… It is tough to trust anyone sitting up there in those power positions after everything they have been caught for already…
I personally think we could see lower prices in the coming month then the market will bottom and we will see new highs for 2010.
Weekend Commodity & Index ETF Trading Strategy Conclusion: Stepping back and looking at the above charts it looks as thought we could see stocks and commodities digest the recent moves. In short, gold and silver have rallied strong and now trading near resistance. Oil dropped last week and is now trading near a key support level. I feel it the market will trade sideways and stabilize before for a while as the SP500 had that crazy drop last week and now the market is in shock. I figured it would see 3-4 weeks to reach those prices yet it happened in 1 day so now the market could do very little for 3-4 weeks…
The US dollar is something we will be watching more closely because it’s trading at key resistance level. In the past it has taken a month or two for a rally to roll over and head back down. This could play out very nicely if the dollar tops and the rest of the market trends sideways to digest the recent moves. Once the dollar starts to fall it will provide fuel for the next rally in both stocks and commodities.
Gold's rally continued last week and reached as high as 1214.8. Initial bias remains on the upside and further rally could be seen to 1227.5 high. However, as note before, we're treating rise from 1044.5 as the second wave of the consolidation from 1227.5, we'd expect strong resistance at 1227.5 to conclude the rise from 1044.5 and bring reversal. Below 1193 minor support will flip intraday bias back to the downside first. Further break of 1156.2 will turn outlook bearish for a test on 1044.5 support. Though, note that decisive break of 1227.5 will confirm up trend resumption for 1300 psychological level next.
In the bigger picture, our preferred view is that price actions from 1227.5 are consolidation in the larger up trend with first leg completed at 1044.5. Rise from there represents the second leg and should conclude after being limited by 1227.5 and bring the third down leg towards 1044.5. However, note that sustained trading above 1227.5 high will indicate that the correction has indeed completed at 1044.5 already and long term up trend is resuming. In such case, Gold should target 100% projection of 931.3 to 1227.5 from 1044.5 at 1340.7 next.
In the long term picture, rise from 681 is treated as resumption of the long term up trend from 1999 low of 253 after interim consolidation from 1033.9 has completed in form of an expanding triangle. Next long term target is 100% projection of 253 to 1033.9 from 681 at 1462 level. We'll hold on to the bullish view as long as 931.3 structural support holds.
WOW....Now that was an exciting day in the market!! This day will be talked about for years to come and the individual who hit the wrong button (“B” for billion instead of “M” for million) to sell billions instead of millions will have a tough time finding another job… Maybe this person can do commercials for Microsoft Windows showing how one simple key stroke can crash a system… lol
On a more serious note, a member in the chat room had a good point… Who would create a program that can not only bankrupt the company in one key stroke but also crash the entire broad market in 10 minutes losing millions of investor’s hard earned money??
I will keep this short with my Cole Notes Version on a few opinions of mine.
Banks – Good for taking your money and crashing the markets All we have heard about in the past year is bank this, and bank that…. They take our money, bet on crazy investments, lose it, then get free money from the Feds to replace that lost money and they keep it for them selves….
Well today the market crashed because of a bank which should not be a surprise after everything else they have messed up. But to add more to the fire I had a lot of subscribers and followers today tell me they tried to trade with their brokers and they could not get orders to be executed. When I asked these individuals who they are using I got the same response… They were trading through a bank… This really makes my upset as I hate watching the bad guys (banks) keep winning/taking everyone’s money…..
Stock Market Circuit Breakers Failed I find it amazing how the financial system has circuit breakers to protect investors from a market crash yet today they did not get triggered…
Rule is (and dumb one in my opinion) is that a circuit breaker (halts trading on the stock market for a set period of time) can only be triggered before 2:30pm ET. Funny thing is that the crash happened 7 minutes after 2:30. Manipulation???
2-3 Week Market Correction, Corrected in One Day A pullback in the broad market which normally would have taken a few weeks at the most happened in one afternoon which is amazing really. Don’t get me wrong, I thought what happen today was very interesting, profitable and a lot of fun. But a move this drastic does throw a wrench into everyone technical analysis and it will be a few days before we get enough price action to start piecing this market back together for what looks most likely to unfold in the coming days and weeks.
Gold & US Dollar Rally Together The past 2 weeks we have seen gold and the dollar move up together. This is very strong for gold. Even if we see the dollar roll over and head south that would help boost the price of gold… The short term charts for gold are looking tired be sure to watch the video below.
End of week Trading Conclusion: This week was a crazy one with gold and the dollar moving higher together and the stock market crashing over 9% in one day…
It will take a few days for all this extreme price action to smooth out as we try and grasp if this is a bottom or the beginning of a major meltdown.
It has been an exciting couple weeks with the stock market slowly forming its top before breaking down this week. I have been warning everyone keep tightening your protective stops and to keep new positions small because once prices start to sell off they will most likely drop like a rock.
This week we have seen all the markets around the world breakdown and this indicates that there could be some large waves of selling in the near future. Traders and investors are very bullish on both stocks and commodities and financial market is designed to hurt the largest group of investors possible. So with over 53% of trader’s bullish and only 18% bearish (same readings as the Jan high) it makes for a perfect blood bath in the market catching the majority off guard left holding the shares.
Here is a chart of the SP500 ETF – SPY Daily Chart
You can see from simple analysis these repeated patterns in price and volume.
Mid-Week Trading Conclusion:
The broad market is now in the middle of a trend reversal and during times like these we can see wild price swings in stocks and commodities making trading much more difficult. But a few more sessions and we should see things smooth out and provide some great shorting opportunities before the market starts to head back up to make new 2010 highs.