We focus on Gold, Oil, Silver, Index & Sector ETFs. When following our technical analysis and proven ETF trading strategy, trades become very clear and simple to execute
Despite initial setback, Gold's rebound from 1315.8 extended last week and the break of 1350 resistance suggests that pull back from 1388.1 is finished. Further rise is in favor to retest 1388.1 resistance first. Nevertheless, decisive break there is still needed to confirm up trend resumption. Otherwise, we'd should still see another fall to 38.2% retracement of 1155.6 to 1388.1 at 1299.3 before the consolidation concludes.
In the bigger picture, rise from 1155.6 is treated as the fifth wave of the five wave sequence from 1044.5, which should also be fifth wave of the rally from 681 (2008 low). While a short term top is in place at 1388.1, there is no confirmation of reversal yet. Recent up trend could still extend further to 161.8% projection of 931.3 to 1227.5 from 1044.5 at 1449.6 before completion. Though, we're aware of long term projection target of 100% projection of 253 to 1033.9 from 681 at 1462 and we'd anticipate strong resistance from there to bring medium term correction finally. On the downside, however, break of 1266.5 resistance turned support will be an early alert of medium term reversal and will turn focus back to 1155.6 support for confirmation.
In the long term picture, rise from 681 is treated as resumption of the long term up trend from 1999 low of 253. The anticipated correction didn't happen and gold will now likely climb further to 100% projection of 253 to 1033.9 from 681 at 1462 before making a top.
Gold's correction from 1388.1 extended further last week and the break of 1325.6 support confirmed that a short term top is at least formed. Initial bias will remain on the downside this week and further fall should be seen to 38.2% retracement of 1155.6 to 1388.1 at 1299.3 and below. On the upside, above 1349.6 minor resistance will flip bias back to the upside for a test on 1388.1 first.
In the bigger picture, rise from 1155.6 is treated as the fifth wave of the five wave sequence from 1044.5, which should also be fifth wave of the rally from 681 (2008 low). While a short term top is in place at 1388.1, there is no confirmation of reversal yet. Recent up trend could still extend further to 161.8% projection of 931.3 to 1227.5 from 1044.5 at 1449.6 before completion. Though, we're aware of long term projection target of 100% projection of 253 to 1033.9 from 681 at 1462 and we'd anticipate strong resistance from there to bring medium term correction finally. On the downside, however, break of 1266.5 resistance turned support will be an early alert of medium term reversal and will turn focus back to 1155.6 support for confirmation.
In the long term picture, rise from 681 is treated as resumption of the long term up trend from 1999 low of 253. The anticipated correction didn't happen and gold will now likely climb further to 100% projection of 253 to 1033.9 from 681 at 1462 before making a top.
The equities market reversed to the upside Wednesday posting a light volume broad based rally. Remember light volume tends to have a neutral to upward bias on stocks, But it was mainly the sharp drop in the dollar which spurred stocks and commodities higher.
Today’s bounce was not much of a surprise for several reasons…
• Overall trend is up, one day sell offs are generally profit taking
• Panic selling on the NYSE tipped us off that the market was oversold
• I don’t think they will let the market fall before the November election
• Intermediate cycle is turning up this week, 3 weeks of upward momentum…
US Dollar Index – 4 Hour Chart
The dollar put in a big bounce this week filling its gap window… Remember most gaps get filled with virtually every investment vehicle so when you see them remember this chart....
SPY ETF – Daily Chart
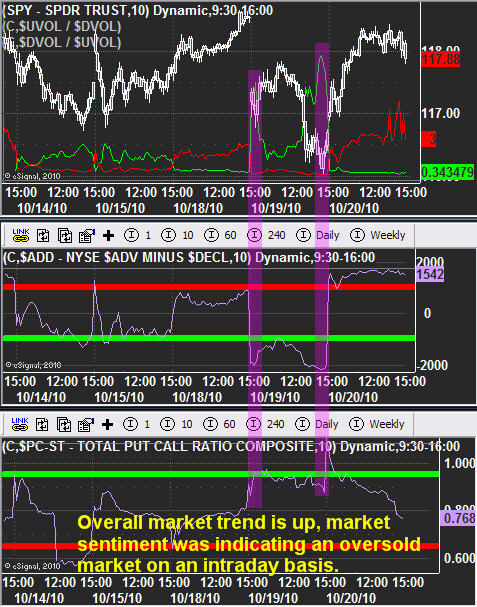
SP500 has been riding the key moving average up and Tuesday’s sell off tagged the 14MA along with extreme market internal readings telling intraday traders that a bounce is about to take place.
Gold Futures – Daily Chart
You can see gold has done much the same… A sharp profit/stop running sell off, which took the price back down to support. We took a long position to catch this bounce and hopefully a larger move going forward.
Market Sentiment Readings
Tuesday’s pullback was a great reminder of just how over extended the equities market was. These heavy volume sell offs are typical in a bull market. Without regular pauses in price, traders tend to place trailing stops moving them up each day. With traders chasing stocks higher bidding them up instead of waiting for a pullback we get a very large number to stop orders following the price up each day. Then, it’s only a matter of time before a key short term support level is broken at which point the flood gates open and everyone’s stops turn to market orders flooding the stock exchanges with sell orders causing a rapid decline and panic selling. This is exactly what happened on Tuesday which I show in the chart below.
Understanding how to read market internals provides great insight for short term traders looking to make quick high probability trades every week… Market internals are just part of the equation but very powerful on their own with proper money/position management. Both of these intraday extremes were bought on Tuesday in the advanced chatroom (FuturesTradingSignals.com).. We quickly booked profits and moved our stops up in order to protect our capital as the market surged higher.
Mid-Week Market Trend Analysis:
In short, the US Dollar is still in a down trend overall. The Fed’s I would think will continue to hold the market up into the election. It works well for them… they print money which devalues the dollar, and in return boosts stocks and commodities, plus they get trillions of dollars to spend… I’m sure its like kids in a candy store over there.
While everyone is trying to pick a top in this over extended market I think it is crucial to stick with the overall trend and to not fight the Fed. Using the key moving averages on the daily chart as shown in the charts above, continue to buy on dips until the market closes below the 20 day moving average at which point you should abandon ship.
Following the gold market as we do, it was amazing that nobody, and I mean nobody, was bearish on this market. This always creates a problem as the markets tend to reverse when everyone is on one side and there’s no one else left to buy.
Another tip off was on Fox Business News and also on CNBC indicating that gold was going to hit $1400 almost immediately. Well after Tuesday, we know what was to happen to the price of gold. If gold were so strong, should it really have gone down almost $70 in 4 days?
This is where technical analysis and Japanese candlestick charts really shine in my opinion. What happened in gold was a classic candlestick formation that any trader, whether they trade gold or other markets, should be aware of.
In this short video, we illustrate how this formation occurred and how it was confirmed the next day, and I don’t mean on Tuesday. We also have a free candlestick book that I’m making available along with this video.
As always there is no need for registration and the video is with our compliments. Please feel free to leave us a note on this or other videos in the comments section of this blog.
Gold jumped to 1388.1 new record high last week before making a temporary top there and retreated. Upside momentum is seen diminishing with mild bearish divergence condition in 4 hours MACD. But there is no sign of topping yet as long as 1325.6 support holds and current rally is still expected to continue. ABove 1388.1 will target 1400 psychological level and then 161.8% projection of 1084.8 to 1266.5 from 1155.6 at 1449.6 next. Though, break of 1325.6 will indicate that a short term top is formed and bring deeper correction first.
In the bigger picture, rise from 1155.6 is treated as the fifth wave of the five wave sequence from 1044.5, which should also be fifth wave of the rally from 681 (2008 low). Recent acceleration suggests that current rally would probably extend further to 161.8% projection of 931.3 to 1227.5 from 1044.5 at 1449.6 before completion. Though, we're aware of long term projection target of 100% projection of 253 to 1033.9 from 681 at 1462 and we'd anticipate strong resistance from there to bring medium term correction finally.
In the long term picture, rise from 681 is treated as resumption of the long term up trend from 1999 low of 253. The anticipated correction didn't happen and gold will now likely climb further to 100% projection of 253 to 1033.9 from 681 at 1462 before making a top.
A lot of what is driving the recent stock market and commodity rally can be attributed to the plummeting Dollar. To some degree the rally in Gold (GLD) is almost getting parabolic in nature. While we've been longer-term bullish on Gold for some time, such a strong uptrend becomes more and more likely to break down sharply. Feel free to ride up such a strong uptrend, but take profits quickly and be prepared to jump on the bearish side should it break down -- because it will correct sharply and quickly when it does.
Take a look below at the recent very strong inverse correlation between GLD (yellow) and the Dollar ETF (UUP, green). When/if this does break down a bit with the Dollar rallying and Gold selling off, option traders can consider a Long UUP, Short GLD paired trade strategy. But don't jump in front of this runaway train yet.
And wherefore the Dollar, which more and more seems to be the main driver of the recent big rally in many commodities and strenght in stocks. Using the US Dollar Index (DXY), which goes back 30 years+, you can see below that we've reached the lowest levels ever since the economic crisis occurred. As I've mentioned previously, a weak currency is NOT good for a country and its economy over the long-term (although some make the argument that it does boost the power of our exports). Buying power and wealth of Americans are badly hurt when foreign good become more relatively expensive and inflation raises the prices of basic commodities. And think about it from a traveler's perspective ... if you travel to a country with a very poor exchange rate, making it basically dirt cheap to go there ... what do you equate that with? A third world or emerging economy, basically. Not good for the once strong USA, in my view.
So where can the Dollar bottom out? Well, looking at the DXY Weekly Chart below, you can see we're in a pretty steep downtrend, so don't fade this just yet. Notice that the recent downtrend began when we failed at the same top that was resistance in late 2008 and early 2009. We are fast approaching the area where the DXY bottomed in late 2009, and beyond that lies the significant lows of the 2008 panic.
Bottom line: The Dollar and its various ETFs and Indexes are in a free fall, so don't jump in front of a falling knife. This is contributing to strong rallies in Gold and other commodities and also helping push stocks higher to some degree. These types of parabolic trends in Dollar and Gold will tend to steepen and steepen until it breaks down sharply, right at the top (or bottom) when the biggest greed of an "easy trade" comes in. So ride these trends while they last, but limit exposure and take profits quickly, when these end they usually reverse hard and rapidly, and jump on the other side for profits in both directions from option trading.
It's been an interesting week with stocks, commodities and currencies having a knee jerk reaction to the FOMC minutes released Tuesday afternoon. In short the Fed clearly said there must be more quantitative easing before things will get better. It was this news which triggered a rally in both stocks and commodities. Quantitative easing is a fast way to devalue the dollar and the Fed is doing a great job at that. As long as the dollar continues to decline the stock market will keep rising.
This week kicked off earning season with INTC and JPM beating analyst estimates. We usually see the market trade up the first week of earnings and then start to sell off by the end of earnings season. Both INTC and JPM sold off on strong volume today despite the good earnings and today’s broad market rally. This just goes to show the market has not forgot about buy on rumor sell on news… The big/smart money sold into the morning gaps exiting at a premium price. Is this foreshadowing for what is to come?
Take a look at the chart below which shows the falling dollar and how its helping to boost stocks and commodities.
While earnings season is trying to steal the spot light in the market, the fact is everything for the past 2 months has been about the US Dollar. If you put a chart of the dollar and the SP500 together they trade almost tick for tick in reverse directions. The amount of money getting pumped into the market cannot last and it will lead to a huge volume reversal day in due time. Until this happens the market will trade higher.
Taking a look at the SPY daily chart the 5, 10, and 14 simple moving averages tend to act as buy zones. The market was choppy from April until about 2 months ago. Now we are seeing the market smooth out and traders are switching to more of a trend trading strategy and not so much looking for extreme sentiment levels which typically signal short term tops and bottoms. Focusing on buying at these moving averages has been providing good support thus far. Stops should be set on a closing basis, meaning if the market is to close below the moving average then exiting the position is a safe play. It’s always best to layer your stops (scale out) in trending market. So stops below the 5, 10, 14 and even the 20ma will provide you with enough wiggle room to riding a trend.
Mid-Week Trading Conclusion:
In short, we are in a strong uptrend and until we get a major reversal day, buying the market is the way to go. The market as we all know is way over bought so if you decide to take a position on your own, be sure to keep it small. I would also like to note that financial stocks were the worst performing on the day so that could be telling us there could be some profit taking in the next day or two.
Market Noise is Deafening
When we don't know what to do or where to go, we ask someone. The obvious path is not so any longer and we need direction. Well, in the markets we're now at that critical juncture. Much like the 'advice' that was given in fall 2008, bargains of a lifetime, 'you have to be in this market', long term it makes sense, etc, only to have markets fall another 50% into the spring of 2009. Was that advice we needed to follow? Today, the word on the 'street is 'how far this rally can go, and should I stay or get on the sidelines'. Naturally, market sages will tell you to stay the course if you're invested, they want you all in at all times. Yet with all the noise and distractions around can we afford to make the one decision that could lead to a setback? The LESS we listen to media accounts, hurray the Dow hit 11,000 again, let's have a party, the better off we'll be. It'll be all over the place now and louder than ever! This type of 'workplace noise' can be hazardous, a news story the other evening stated that those prone to noise at work are more likely to have a stroke, heart attack or high blood pressure. Let the market tell you WHEN to should exit, remain or re-enter.
What's All this Fed Talk About?
We've heard quite a bit lately about this Fed game called QE2. To be sure, they are playing upon our positive expectations at the end of the game. The hope is that this program will help spur some economic activity, inflation and move people back to work. But, what is QE2, and did what did QE1 accomplish? Simply put, QE is quantitative easing, implemented when the Fed has no more additional room to cut short-term rates to stimulate the economy. Basically, cutting borrowing rates has failed to control the money supply. By definition, QE is upping the supply of money by increasing excess reserves of the banking system, expanding their balance sheet. By purchasing government assets and other bonds in the open market they give banks excess reserves required to create new money. Hopefully the banks will use this extra money to lend out to borrowers, thereby stimulating activity. Many argue this is the wrong approach, creating dollars. To be certain, QE measures have had mixed results and there is not a direct correlation to creating new jobs, which seems to be the big issue of today. Back in early 2009 the Fed implemented the first round of QE and while it improved growth a bit, the desired effect and length lagged badly. In fact, the economy recently fell into a 'soft patch', enough warning for the Fed to jump to the fore with their new easing plan. Is that a pattern we'll see develop over time?
Metals are sure Precious!
New highs again for gold, new multiyear highs for silver. Haven't seen such a blistering move on a commodity since crude oil went parabolic in 2008. Do we know the reasons for this parabolic rise, or do we 'think' we know the reasons. By all accounts it seems everyone is talking about the metals these days. Heck, there are four new gold shops that popped up in my town over the last several months, and on every other street corner is a guy holding a sign that says 'will buy your gold'. The fever pitch is reaching that of the miner 49ers over 160 yrs ago! Can it last? Sure, any bubble move can keep going until every last one gets in and then POP! I'm not calling for this, but certainly the reasons for buying gold are consistent with past bubbles, oil, housing, tech, and biotech. Oh, I've participated, silver has been my choice, but if you fail to acknowledge what is happening around you then you'll get taken in by the hype. We choose to listen to what and whom we want that makes us feel good (read up top again about the noise factor). Being in a bubble and profiting is ok, in fact it's great as an options player, but knowing your exit is most important. Enjoy the ride while it lasts!
Check out Bob Lang's calls and articles at Big Trends.Com
Gold rose to another record high of 1366 last week before turning sideway. A short term top is possibly formed and some consolidations would be seen initially this week below 1366 level. Though, strong support should be seen at 38.2% retracement of 1155.6 to 1366 at 1285.6 to contain downside and bring up trend resumption. Break of 1366 will target 161.8% projection of 1084.8 to 1266.5 from 1155.6 at 1449.6 next.
In the bigger picture, rise from 1155.6 is treated as the fifth wave of the five wave sequence from 1044.5, which should also be fifth wave of the rally from 681 (2008 low). Recent acceleration suggests that current rally would probably extend further to 161.8% projection of 931.3 to 1227.5 from 1044.5 at 1449.6 before completion. Though, we're aware of long term projection target of 100% projection of 253 to 1033.9 from 681 at 1462 and we'd anticipate strong resistance from there to bring medium term correction finally.
In the long term picture, rise from 681 is treated as resumption of the long term up trend from 1999 low of 253. The anticipated correction didn't happen and gold will now likely climb further to 100% projection of 253 to 1033.9 from 681 at 1462 before making a top.
Wednesday’s session closed mixed on the day. The DOW posted a third of a percent gain while the tech sector closed down almost nine tenths of a percent. While technology stocks have been leading the market higher in the recent months, today they took the back seat while the DOW took control. Take a look at the intraday chart of the SPY price action compared to the tech sector. It’s clear the tech stocks where not in favor today. Some tech stocks that really took a beating today were FFIV, NTAP, APKT and AKAM. On another note, we are entering earning season and I am wondering if we are going to see a “Sell the New” type of thing again.
The broad market is experiencing a 36 day down cycle which has played a very dominant roll in the market this year. It topped out 9 days ago so we should expect sideways chop or some selling over the next 9 trading session. Because the market is trending up, pullbacks should be shallow.
The market continues to grind its way higher on relatively light volume. I have been waiting several weeks now for the volume to come back into the market but its just not happening. The majority of shares being traded are from banks, funds and day traders as the average investor’s not taking part because of the uncertainty looming. The lack of volume (commitment) to the market from the masses is making the market internals swing from one extreme to another on virtually weekly basis making it more difficult to take advantage of short term extreme sentiment levels.
The current market environment has traders shifting gears to more of a momentum trading strategy to take advantage of trends and this is what I am going to start implementing again as the market expands.
Market Conclusion:
In short, the equities market is in an up trend but looks to be overbought. Also with the downward cycle I don’t think the market will expand here and take off. Rather it will most likely chop around and burn off time until some earnings are released and the cycle bottoms. Unless we get a really sharp reversal down which we have yet to see on the SP500 or DOW, nibbling on small long positions or staying in cash is what I am doing right now.
As for gold, silver, the dollar and oil… Well the dollar continues to lose value on a daily basis which in turn is boosting metals along with crude oil. All four of those investments are over extended but they are trending and not really looking like they want to reverse just yet.
Last August I penned an article predicting a massive five year bull run in gold and gold stocks. I outlined my reasoning and compared this 13 year period from 2001 to 2014 to the tech stock bull from 1986-1999. .
In February of this year, I again wrote an article for Kitco.com explaining the 13 year Gold Bull still had a lot more room to run. At the time Gold had pulled back to 1040-1070 windows and I mentioned that “smart money would be accumulating” and we should look for $1300-$1325 as the objective. That brings up forward to October of 2010, with Gold running to $1350 as recently as this morning.
We have a huge rally because we are in the 2nd year of this final 5 year run I predicted, and this is when the general investing public becomes “aware” of the bull market. They miss the first five years from 2001-2006, and then while we consolidate for three years from 2006-2009 they fall asleep. It is not until Gold breaks all time highs that people wake up and start buying. This is typical in a super bull cycle, the behavioral patterns are always the same with the herd. I based my forecast on herd mentality, whether bullish or bearish.
I am now looking for Gold to continue to run during this trampling into the asset from the herds of investors to about $1480-$1520 on this leg before we have a strong correction. That figure is not taken out of the thin air, it’s an Elliott Wave based pattern that I recognize and forecast in advance. Subscribers to my website are exposed to my outside the box forecasts on the SP 500 and Gold all the time. Usually it starts with them not believing, and later they wonder how I arrived at the predictions. To wit, on August 30th I predicted a huge breakout in Silver to $26-$29 per ounce when it was at $18.75 per ounce. This was purely based on the Elliott Wave pattern and the lack of awareness by the investing public at the time of the Silver bull. It is also “poor man’s Gold”, and as simple as that sounds, it is what drives the herd of investors to invest. Look for Silver to continue higher to those target zones before correcting.
Many investors who are briefly exposed to Elliott Wave Theory assume that a certain well known forecaster must be the only person in the world who uses it. Since he is wrong more often than he is right, people toss out Elliott Waves as mad science. That is a mistake and why I continually write articles for Kitco using my Elliott Wave methods to forecast SP 500 and Gold moves in advance. Look for Gold and Gold stocks to continue powering higher than people can imagine over the next four years, and pick up some darts and throw them at some juniors while you’re at it.
You can check out our forecast service at www Market Trend Forecast.com, consider subscribing ahead of our rate increase as well. Best to you and your trading!
Recently we posted a video that projected some amazing levels for gold. Given the strong upward trend in gold and the price action on Tuesday the 5th of October, it is worthwhile looking at this video again. Today's new short video will certainly give you some more interesting price targets for gold that are based on sound trading principles. We hope you enjoy the video, and as always we would love to have your feedback so please leave a comment. The video is free to watch and there are no registration requirements.
A question that has become very prevalent recently is whether in a world denominated in fiat ponzi equivalents, in which central banker intervention is hell bent on devaluing this very system, whether gold (with a recent Sharpe ratio most portfolio managers can only dream of) is not currently the best hedge against tail risks. Conveniently, the World Gold Council has just released a paper, and, for those with a shorter attention span, a video clip, which provides an affirmative answer to that question.
From the WGC: "In the analysis the WGC shows that during the period between October 2007 and March 2009, the height of the global financial meltdown, an investor with a portfolio of US$10 million experienced an additional US$500,000 financial loss simply by not maintaining a position in gold. The study used a composition similar to a benchmark portfolio, which included an 8.5% allocation to gold, to show that total losses incurred during the period reduced by 5% relative to an equivalent portfolio without gold."
But before we get into the WGC paper's findings, we would like to point out a special report by Reuters which confirms what all the "goldbugs" have known all along: "The world's wealthiest people have responded to economic worries by buying bars of gold, sometimes by the ton, and moving assets out of the financial system, bankers catering to the very rich said on Monday... A banker said, "We had a clear example of a couple buying over a ton of gold ... and carrying it to another place."
Guess why JPMorgan is doing all it can to preserve as much physical gold within its system before it all runs out, and all those demands for physical delivery skyrocket.....Read the entire article.
Investors around the globe are concerned with the economic outlook, not only with the United States but with virtually every country. This has caused not only investors but banks and countries to start buying gold & silver in order to be protected incase of a currency melt down in the coming years.
While the majority is concerned about the eroding economy, we have seen the opposite in the financial market. Gold and equities have risen… That being said the volume in the market remains light simply because the average investor is no longer putting money into the market for long term growth. Instead individuals are now focusing on saving and paying down debt.
That being said we all know light volume market conditions allow Wall Street powerhouses to bid the market up. Not to mention with quantitative easing taking place I’m sure that has also helped the market of late. While we don’t know for sure that QE is taking place as we speak, the sharp drop in the dollar and strong move up in gold are pricing this into the market.
Let’s take a look at some charts....
HUI – Gold Stock Index
This long term monthly chart of the HUI index provides valuable trading signals for both gold stocks and gold bullion. As you can see below this index is trading at a key resistance level after forming a bullish 3 year Cup & Handle pattern. The next 1-2 months for the precious metals sector will be interesting as it tries to break above key resistance. I would really like to see the HUI:GLD ratio break to the upside to confirm if the breakout occurs.
SPY – Daily Long Term Trend
The broad market looks to be forming a short term topping wedge. If this is to occurI expect it to take several weeks to play out. Looking at the chart if we use Fibonacci retracements along with trend line support we can get a feel for where this pullback should correct to.
That being said the broad market breadth and internals seem to be holding up indicating higher prices over the long run. While the short term price action is overbought and I expect a pullback to form, my analysis is pointing to higher prices as we go into year end.
UUP – US Dollar Daily Price Action
Although the majority of investors have a bearish outlook on the economy, we have seen a large price appreciation in equities and precious metals. This is largely due to the fact that the US dollar is quickly getting devalued. Simply put, as the dollar drops, it helps boost commodities and stock prices.
While a rising stock market is great to see, at some point the dollar will become so cheap that it will start to have a very negative affect on the US economy, commodities and stocks. Being from Canada it has always been more expensive to take holidays in the United States, and I remember paying $1.50-$1.70 for every $1 green back. But now the dollar is almost at par making holidays very affordable. The big question/concern is when will they ease off on the printing? At the rate which they are printing the greenback will be at par with peso… well not that extreme but you get the point Eh!
Weekend Market Conclusion:
As we all know the market has a way of making sure the majority of traders miss major turning points. The saying is, “If the market doesn’t shake you out, it will wear you out” and it seems we are getting the later…
The never ending grind higher in precious metals has not had any big shakeouts, rather its wearing out any short positions before rolling over to take a breather. As for the stock market, we are getting much of the same thing as the market grinds higher day after wearing out the shorts before rolling over.
That being said, there is more at work here than just regular market movements. With the light volume in the market we know there is price manipulation and QE (quantitative Easing) which is helping to boost prices and exaggerate market movements.
Retail investors are flooding into gold. And it's no surprise with Gold (GLD) reaching all time highs again this week more investors are putting cash into anything precious metal related but I am here to caution you on doing so. There are far better opportunities than gold right now and chasing this trend is not the formula for generating short term growth. We have traded GLD call options 8 times this year (7 profitable) in the ETF TRADR portfolio but now it’s time to step away. Of course, what type of ‘tradr’ would I be if I failed to offer a better alternative.
First off, it would be very difficult to find a long term chart more strong and persistent than the Gold chart, it’s nothing short of amazing (and at the same time scary for the future of the dollar). That said, even as Gold has made new highs in recent days there is a better place to focus your trading capital. The semiconductor industry has lifted off in recent days and I expect it to continue. Here’s the performance chart between the headline making Gold (GLD) rally and the Semiconductor ETF (SMH).
So what’s making the semis perform so well? It’s certainly not the lackluster outlook from PC manufacturers who continue to see challenges ahead. It was just three weeks ago when Intel (INTC) slashed their outlook sending the stock down nearly 4%. Others like Cisco have also expressed concern with speak of “unusual uncertainty” in the global economy that could impact sales.
If these headlines weren’t enough many analysts also believe Apple’s iPad is hurting sales of the Semiconductor Industry because the chip is Apple branded and made by Samsung who is not a major Semiconductor. The major players are not benefiting from this particular increase in chip demand. Bottom line, here’s what is making semiconductors (SMH) move.
In a classic contrarian move Semiconductors shifted in to high gear directly after the industry leader (INTC) lowered their outlook. SMH has one of the strongest ETFs trends in September and I believe it will continue. Let’s take a look at the SMH charts to see the how the ETF is trading. We’ll take a look at the following:
Current Trend Analysis (how strong is this trend and how much further can it go) Resistance and Support Levels. How to Enter with a Lower Risk Profile.