We focus on Gold, Oil, Silver, Index & Sector ETFs. When following our technical analysis and proven ETF trading strategy, trades become very clear and simple to execute
It’s been an interesting week with Spain being downgraded as Europe debt crisis widens. This has investors looking at the US dollar in a new light thinking that maybe it’s not that bad of an investment after all. This sent the US Dollar higher along with the price of gold so far this week.
The past 7 days we have seen both the US Dollar and Gold rise together which is not something that happens often. With financial crisis’s popping up around the world I think the US dollar and gold will continue to strengthen (with corrections along the way). I think it will take another 12-24 months before another wave if issues arise in the financial markets and until then we just continue to focus mainly on buying the dips and corrections with the occasional short play in the larger corrections.
SP500 – Daily Chart
On April 14th we saw an extreme level of selling which sent the broad market sharply lower. This sell off was followed by value buyers pushing the prices back up to new 2010 highs.
Well this week we have seen the same extreme selling volume and the question we all want to know is will there be buyers this time around?
ETF & Futures Trading Conclusion
Gold is in a bull market but it was setup for another round of selling but this Spain issue has been a pain. If we had another downward word move on gold to the $1115 – 1120 area it would have washed out the majority of gold bulls resetting it’s self up for a big rally.
The Europe debt crisis has thrown a twist into the picture helping boost the price of gold. Gold could still head lower washing out the weak positions but the picture is fuzzy. Silver did not react much to this news as it’s not really seen as the safe haven gold or the US Dollar are.
As for stock picks and the broad market, it looks and feels like we are about to start a correction. But this week we saw fear in the market again with the VIX and selling volume surging higher to levels which have triggered temporary bottoms in the past. The problem I see here is that some key price levels have been taken out, so the odds are pointing to lower prices in the near future. But Tuesdays panic selling has pushed the market into an oversold condition so we should see a drift upwards for 1-4 days before sellers get active again as they want to sell and short the market at premium prices.
In short, precious metals are not giving any clear price action to take advantage of yet, and the SP500 looks like it’s on its last legs before heading lower for a meaningful correction which should provide a short setup and then a nice long setup once it bottoms out.
Gold futures closed up $10.00 at $1,172.70 today. Prices closed nearer the session high today and hit a fresh nearly five month high. Gold's gains today again came despite a stronger U.S. dollar and lower crude oil futures prices. Traders this week are buying gold as a safe haven asset and as a hedge against further weakening of the European currencies as the Greek debt crisis appears to be worsening. Gold bulls have the solid near term technical advantage and have gained more upside momentum this week.
Silver futures closed down 2.4 cents at $18.095 an ounce today. Prices closed nearer the session high today and saw more profit taking pressure. The U.S. dollar index was higher today, which did limit buying interest in silver. Silver bulls still have the overall near term technical advantage. Prices are still in an 11 week old uptrend on the daily bar chart.
The U.S. dollar index closed up 16 points at 82.47 today. Prices closed near mid-range today and hit another fresh contract high on a flight to quality amid the European Union's sovereign debt crisis. The bulls have the solid overall near term technical advantage and have gained more upside momentum this week.
Nicholas Brooks, head of research and investment strategy for ETF Securities, says investors are buying gold as a safe haven asset as sovereign debt fears continue to mount.
The success of the recent oil auctions in Iraq is creating a windfall for American oil services companies. Schlumberger (SLB), Baker Hughes (BHI), Weatherford (WFT), and Halliburton (HAL) have committed to drilling 2,500-3,000 new wells per year and building new pipeline and shipping terminal infrastructure that could make the country the world's largest oil exporter. The value of these contracts may reach a massive $60 billion over the next six years, and could generate $1 billion in new revenues for each company per year. Two offshore terminals are already under construction, and another two are on the drawing board. If successful, the project will boost the country's oil production from the current 2.5 million barrels a day to 12 million b/d by 2016. Iraq's oil production peaked at 3 million b/d in 1979, and then went to nearly zero after it invaded Iran.
I remember those days well, as I was issued a visa to accompany Saddam's troops to Tehran, only to see it cancelled when the Iranians were able to mount a counter offensive. I still have the dessert camos and telephoto lenses need to cover the desert war, although the pants, regrettably, no longer fit. Iraq's oil industry never recovered. UN sanctions limited the regime to minimal "official" exports that covered humanitarian imports like baby food and drugs. Tanker trucks smuggled out through Jordan what they could, with the proceeds going directly to Saddam's family. When the US invaded, bails of hundred dollar bills were found stashed in private homes, the proceeds of these black market deals.
American oil engineers were shocked by the poor state of Iraq's energy infrastructure after 40 years of neglect. It all has to be rebuilt from scratch. If the new Iraqi government can provide the necessary infrastructure, and stabilize the political and security environment, it will become one of the largest changes to the landscape for international trade in decades. Those are all very big "if's". It will dump another Saudi Arabia's worth of crude on the market.
It will also go a long ways towards meeting China's insatiable demand for oil, and put a long term cap on prices. Of course, this is the scenario that antiwar activists predicted eight years ago, but no one else, especially the Bush administration, thought it would take so long to play out. This is so important that I can't believe no one else is talking about it.
Gold's break of 1170.7 indicates that rise from 1084.8 has resumed. Intraday bias is now on the upside and further rise should be seen to 100% projection of 100% projection of 1044.5 to 1145.8 from 1084.8 at 1186 next. On the downside, below 1147.3 support will turn intraday bias neutral. Also, note that further break of 1124.3 will indicate that whole rise from 1044.5 has completed and will bring deeper decline to 1084.8 support and below.
In the bigger picture, as noted before, the lack of impulsive structure of the rise from 1044.5 so far suggests that it's the second leg of the whole consolidation pattern that started at 1227.5. At this moment, there is no confirmation that rise from 1044.5 is completed yet and another rise might still be seen. However, even in that case, strong resistance should be seen above 100% projection of 1044.5 to 1145.8 from 1084.8 at 1186 to complete the rise and bring the another fall to retest 1044.5 before consolidation from 1227.5 completes. Meanwhile, break of 1084.8 support will indicate that the third falling leg has likely started and will then target a new low below 1044. before completing consolidations from 1227.5.....Comex Gold Continuous Contract 4 Hours Chart.
George Gero, vice president of global futures at RBC Capital Markets, says options expiration, CFTC hearings and Greece debt fears will weigh on gold over the short term, but prices will reach for $1,175 in the long term.
With 4 hours MACD crossed below signal line, a temporary top is in place at 1160.7 and intraday bias is turned neutral. Break of 1135.2 minor support will indicate that recovery from 1124.3 has finished and will flip intraday bias back to the downside for 61.8% retracement if 1084.8 to 1170.7 at 1117.6 and below. On the upside, in case of another rise, we'd expect upside to be limited by 1170.7 resistance and bring another fall.
In the bigger picture, as noted before, the lack of impulsive structure of the rise from 1044.5 so far suggests that it's the second leg of the whole consolidation pattern that started at 1227.5. At this moment, there is no confirmation that rise from 1044.5 is completed yet and another rise might still be seen. However, even in that case, strong resistance should be seen above 100% projection of 1044.5 to 1145.8 from 1084.8 at 1186 to complete the rise and bring the another fall to retest 1044.5 before consolidation from 1227.5 completes. Meanwhile, break of 1084.8 support will indicate that the third falling leg has likely started and will then target a new low below 1044. before completing consolidations from 1227.5.....Comex Gold Continuous Contract 4 Hours Chart.
Gold's choppy recover from 1124.3 continued last week and reached as high as 1157.9. Further rise would probably be seen initially this week. However, since the recovery from 1124.3 is looking corrective in nature, we'd expect upside to be limited by 1170.7 resistance and bring one more fall to continue the whole consolidation. Below 1135.2 minor support will flip intraday bias back to the downside for 61.8% retracement if 1084.8 to 1170.7 at 1117.6 and below
In the bigger picture, as noted before, the lack of impulsive structure of the rise from 1044.5 so far suggests that it's the second leg of the whole consolidation pattern that started at 1227.5. At this moment, there is no confirmation that rise from 1044.5 is completed yet and another rise might still be seen. However, even in that case, strong resistance should be seen above 100% projection of 1044.5 to 1145.8 from 1084.8 at 1186 to complete the rise and bring the another fall to retest 1044.5 before consolidation from 1227.5 completes. Meanwhile, break of 1084.8 support will indicate that the third falling leg has likely started and will then target a new low below 1044. before completing consolidations from 1227.5.
In the long term picture, rise from 681 is treated as resumption of the long term up trend from 1999 low of 253 after interim consolidation from 1033.9 has completed in form of an expanding triangle. Next long term target is 100% projection of 253 to 1033.9 from 681 at 1462 level. We'll hold on to the bullish view as long as 931.3 structural support holds.....Comex Gold Continuous Contract 4 Hours Chart.
Scott Redler, chief strategic officer for T3Live.com, says investors have forgotten gold in the short term but once the price breaks above $1,160, the trade will heat up.
We began Q1 with high hopes of keeping our winning streak alive, just as we had finished out the year on a very positive note with some strong gains in Q4 of 2009. Q1 proved to be a challenging quarter for the "World Commodity Portfolio." Out of the six markets we track, we had winning positions in four markets (that's the good news) and losing positions in the other two. However, the big disappointment in Q1 was the gold market which produced our biggest quarterly loss of any market since we began tracking the "World Commodity Portfolio."
The main reason for this loss was the choppy, trend-less action in the gold market. In the eleven quarters we have been tracking gold, we have made money in eight of those quarters. This is not the time to abandon trading gold, rather it is a time to continue with our game plan and "Trade Triangle" approach that has been so successful for this portfolio. Furthermore we have never had back to back losing quarters in gold.
On the brighter side, the grain markets proved to be resilient and just the ticket as corn, wheat, and soybeans all put in positive performances. The only other market to put in a negative performance in Q1 was crude oil. All these gains were not enough to turn the tide and prevent our only second losing quarter in eleven quarters. While the loss was 6% based on margins of $50,000 (margin is needed to trade the "World Commodity Portfolio") it was still a loss and we hate losses.
As we have said before, diversification is the key, followed by a sound market-proven game plan. This is the one way to positively approach the markets with the odds stacked in your favor. Q2 promises to be better and we expect to turn in a positive performance. This is based on the fact that the "World Commodity Portfolio" has never lost money two quarters in a row. Even with this quarter's loss, the "World Commodity Portfolio" has produced, on average a 60% return per quarter. This number however was greatly skewed with the huge run up in crude oil in Q4 of '08. That being said, it just emphasizes the point that you have to be in it to win it.
The results we show in the "World Commodity Portfolio" are hypothetical and should not be taken as trades that were actually made in the marketplace. The results however, do show and resemble how you would have come out using MarketClub's "Trade Triangle" approach.
If you'd like to know more about this approach visit our website at MarketClub.com
Gold was lower overnight as it consolidates some of this week's rally but remains above the 20 day moving average crossing at 1139.00. Stochastics and the RSI are bearish signaling that sideways to lower prices are possible near term. Closes below the 20 day moving average crossing at 1139.00 are needed to confirm that a short term top has been posted. If June renews the rally off March's low, the 75% retracement level of the December-February decline crossing at 1184.00 is the next upside target. First resistance is the 10 day moving average crossing at 1147.90. Second resistance is last Monday's high crossing at 1170.70. First support is Monday's low crossing at 1124.30. Second support is the reaction low crossing at 1102.40.
Silver was lower overnight as it consolidates some of this week's rally. Stochastics and the RSI are neutral to bearish signaling that sideways to lower prices are possible near term. Closes below Monday's low crossing at 17.490 would confirm that a short term top has been posted. If May renews the rally off February's low, the 87% retracement level of the December-February decline crossing at 18.893 is the next upside target. First resistance is Thursday's high crossing at 18.170. Second resistance is last Monday's high crossing at 18.605. First support is the February-March uptrend line crossing near 17.630. Second support is Monday's low crossing at 17.490.
The U.S. Dollar was higher overnight as it extends the rally off last week's low. Stochastics and the RSI are bullish signaling that sideways to higher prices are possible near term. If June extends this week's rally, March's high crossing at 82.52 is the next upside target. Closes below the 10 day moving average crossing at 81.00 are needed to confirm that a short term top has been posted. First resistance is the overnight high crossing at 82.20. Second resistance is March's high crossing at 82.52. First support is the 20 day moving average crossing at 81.23. Second support is the 10 day moving average crossing at 81.00.
Jon Nadler, senior analyst at Kitco.com, says gold prices could come under more selling pressure if they stay under $1,140, but for now gold will continue to look to the risk trade and euro for direction.
The choppy look of the recovery from 1124.3 suggests that it's merely correction only. Break of 1138.4 minor support will indicate that such recovery is completed and will flip intraday bias back to the downside for 1124.3 and below. On the upside, while stronger rise cannot be ruled out, break of 1170.7 resistance is needed to confirm rally resumption. Otherwise, we'd expect more sideway trading below 1170.7 first.
In the bigger picture, as noted before, the lack of impulsive structure of the rise from 1044.5 so far suggests that it's the second leg of the whole consolidation pattern that started at 1227.5. At this moment, there is no confirmation that rise from 1044.5 is completed yet and another rise might still be seen. However, even in that case, strong resistance should be seen above 100% projection of 1044.5 to 1145.8 from 1084.8 at 1186 to complete the rise and bring the another fall to retest 1044.5 before consolidation fro 1227.5 completes. Meanwhile, break of 1084.8 support will indicate that the third falling leg has likely started and will then target a new low below 1044. before completing consolidations from 1227.5.....Comex Gold Continuous Contract 4 Hours Chart.
In this new video, we show you how this market is setting itself up for a large move to the upside. We'll also point out that we don't think this is going to happen tomorrow. The video is about two minutes long and we think it will give you a great insight into the past and future of this particular market.
As always, our videos are free to watch and there are no registration requirements. Please feel free to leave a comment and let us know what you are thinking about the direction of gold.
Gold's recovery was limited by 4 hours 55 EMA and turns sideway. At this point, stronger recovery could still be seen but after all, break of 1170.7 resistance is needed to confirm rally resumption. Otherwise, we'd expect more sideway trading below 1170.7 first. On the downside, however, below 1124.3 will bring deep fall towards 1084.8 support.
In the bigger picture, as noted before, the lack of impulsive structure of the rise from 1044.5 so far suggests that it's the second leg of the whole consolidation pattern that started at 1227.5. At this moment, there is no confirmation that rise from 1044.5 is completed yet and another rise might still be seen. However, even in that case, strong resistance should be seen above 100% projection of 1044.5 to 1145.8 from 1084.8 at 1186 to complete the rise and bring the another fall to retest 1044.5 before consolidation fro 1227.5 completes. Meanwhile, break of 1084.8 support will indicate that the third falling leg has likely started and will then target a new low below 1044. before completing consolidations from 1227.5.....Comex Gold Continuous Contract 4 Hours Chart.
Gold futures closed up $4.70 at $1,140.50 today. Prices closed near mid-range today and saw a corrective bounce from selling pressure last Friday and on Monday. Higher crude oil prices added to buying interest in gold today. Uncertainty regarding the Goldman Sachs fraud charges from the SEC seem to have abated a bit, which also supported buying interest in gold today. No serious chart damage has occurred in gold, but the bulls need to show more power soon to keep the uptrend on the daily chart in place.
Silver futures closed up 11.9 cents at $17.85 an ounce today. Prices closed near mid-range today. The key "outside markets" were in a mostly bullish posture for silver today, as the U.S. dollar index was near steady, while crude oil and the U.S. stock indexes were higher. Silver bulls have the overall near term technical advantage. Prices are in a 2 1/2 month old uptrend on the daily bar chart.
The U.S. dollar index closed up 3 points at 81.13 today. Prices closed nearer the session high today in quieter trading. The bulls have the overall near term technical advantage. Bulls' next upside price objective is to close prices above solid technical resistance at the April high of 82.06.
J.C. Doody, editor of goldstockanalyst.com, says argues that short term volatility in the gold price is irrelevant as the real interest rate is what really influences gold prices.
Gold recovers strongly after hitting 1124.3 and with 4 hours MACD crossed above signal line, a temporary low should be in place. Stronger recovery could now be seen but after all, break of 1170.7 resistance is needed to confirm rally resumption. Otherwise, we'd expect more sideway trading below 1170.7 first. On the downside, however, below 1124.3 will bring deep fall towards 1084.8 support.
In the bigger picture, as noted before, the lack of impulsive structure of the rise from 1044.5 so far suggests that it's the second leg of the whole consolidation pattern that started at 1227.5. At this moment, there is no confirmation that rise from 1044.5 is completed yet and another rise might still be seen. However, even in that case, strong resistance should be seen above 100% projection of 1044.5 to 1145.8 from 1084.8 at 1186 to complete the rise and bring the another fall to retest 1044.5 before consolidation fro 1227.5 completes. Meanwhile, break of 1084.8 support will indicate that the third falling leg has likely started and will then target a new low below 1044. before completing consolidations from 1227.5.....Comex Gold Continuous Contract 4 Hours Chart.
Last week was exciting with broad market and gold forming an intraday reversal pattern after a long overbought rally, then broke down though short term key support levels. While this move lower was tough on the pocket book for those who chased the market up the past few days and/or were not moving their protective stops up, this move is good for the health of the market.
This pullback is actually a good thing for us active traders who wait for low risk setups and don’t chase prices higher, but rather buy on the dips in a bull market when most of the risk has been flushed out already. Trading with low risk setups is not the most exciting type of trading because there are not a ton of setups but if one can be patient and wait for these plays it is a very profitable strategy in the long run.
Those traders who live and breathe the market focusing on trading intraday price action most likely made a small fortune last week with Fridays sell off in stocks and precious metals. You can see how some of us took advantage of this sharp pullback last week with my before and after videos.
Below are the charts showing what I am currently thinking is going to happen for gold, silver, gold stocks and oil. I will be tracking the market with intraday charts to help pin point a low risk entry point for a possible short or long position as the market unfolds this week.
GLD – Gold Trading ETF
The chart below is an updated chart which I have showed several times. It shows how gold corrected, bottomed and is now trending back up. This week I will be watched closely to be sure we take a position which has the highest probability of working in our favor if and when a low risk setup occurs.
SLV – Silver Trading ETF
Silver really took a hit on Friday. It is now trading near support but there is not much we can do until we see what happens on Monday. There could be a bounce or more down side, tough to call right now…. And it’s not something you want to be on the wrong side of.
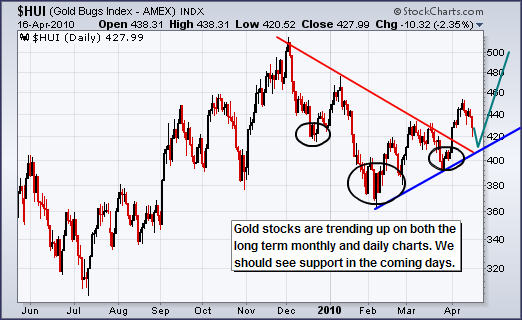
Gold Stocks – Gold Stock Trading
Gold stocks did not drop as much as I thought they would which indicates the market is still very bullish on gold. There is still potential for more downside… so I am letting the market unfold before doing anything.
USO – Oil Trading Fund
You can see oil moved down sharply on Friday and is now testing both a price support level and trendline support. Although this looks like a perfect setup, the market is designed to shake people out of positions before continuing the move. So it is likely for oil to dip which would break both these support levels triggering stop orders. Then the price should drop to the key support level where support should be found for at least a bounce or a new bottom.
Precious Metal & Oil ETF Trading Conclusion:
In short, the market had a nice correction on Friday and the heavy selling volume indicates that we are getting close to a larger correction which should provide two swing trades, a shorting opportunity and a new buying opportunity in the coming days, weeks or months depending how long the market takes with this pullback/correction.
Despite edging higher to 1170.7, the subsequent reversal and short fall on Friday sent gold below 38.2% retracement of 1084.8 to 1170.7 at 1137.9. Such development suggests that rise from 1084.8 has completed. More decline would be expected initially this week to 61.8% retracement at 1117.6 and below. On the upside, break of 1170.7 is needed to confirm rally resumption. Otherwise, short term outlook will be neutral at best.
In the bigger picture, as noted before, the lack of impulsive structure of the rise from 1044.5 so far suggests that it's the second leg of the whole consolidation pattern that started at 1227.5. At this moment, there is no confirmation that rise from 1044.5 is completed yet and another rise might still be seen. However, even in that case, strong resistance should be seen above 100% projection of 1044.5 to 1145.8 from 1084.8 at 1186 to complete the rise and bring the another fall to retest 1044.5 before consolidation fro 1227.5 completes. Meanwhile, break of 1084.8 support will indicate that the third falling leg has likely started and will then target a new low below 1044. before completing consolidations from 1227.5.
In the long term picture, rise from 681 is treated as resumption of the long term up trend from 1999 low of 253 after interim consolidation from 1033.9 has completed in form of an expanding triangle. Next long term target is 100% projection of 253 to 1033.9 from 681 at 1462 level. We'll hold on to the bullish view as long as 931.3 structural support holds.....Comex Gold Continuous Contract 4 Hours Chart.
Gold is still bounded in choppy sideway trading below 1170.7 and intraday bias remains neutral. Another fall might be seen but downside should be contained by 38.2% retracement of 1084.8 to 1170.7 at 1137.9 and bring rally resumption. Break of 1170.7 will target 100% projection of 1044.5 to 1145.8 from 1084.8 at 1186 level next.
In the bigger picture, price actions from 1227.5 are treated as correction to rise from 931.3 only, no doubt. The lack of impulsive structure of rise from 1044.5 argues it's possibly part of consolidation from 1227.5, rather than resumption of the long term up trend. Hence upside will likely be limited by 1227.5 high and bring at least one more fall before the consolidation concludes. On the downside, below 1084.8 support will indicate that the third leg of consolidations has started and should then target 1044.5 again.....Comex Gold Continuous Contract 4 Hours Chart.
We owe trillions of dollars, but Crude oil is at $86 a barrel, the DOW, S&P, and NASDAQ are making new highs almost everyday and unemployment is officially at 9.7%.
Everything is great! Happy days are here again... Right?
So is the DOW, S&P, and NASDAQ all going to keep going higher forever? Or are the teachings of a dead mathematician going to reverse this juggernaut of a market?
In our new video we show you exactly what we mean and how the these indices could be very close to a very important tipping point.
This is without a doubt, one of the most important videos we have ever made and if you are concerned about your financial future, you don't want to miss it.
As always, our videos are free to watch and there are no registration requirements.
Intraday bias in gold remains neutral as consolidation from 1170.7 continues. Another fall might be seen but downside should be contained by 38.2% retracement of 1084.8 to 1170.7 at 1137.9 and bring rally resumption. Break of 1170.7 will target 100% projection of 1044.5 to 1145.8 from 1084.8 at 1186 level next.
In the bigger picture, price actions from 1227.5 are treated as correction to rise from 931.3 only, no doubt. The lack of impulsive structure of rise from 1044.5 argues it's possibly part of consolidation from 1227.5, rather than resumption of the long term up trend. Hence upside will likely be limited by 1227.5 high and bring at least one more fall before the consolidation concludes. On the downside, below 1084.8 support will indicate that the third leg of consolidations has started and should then target 1044.5 again.....Comex Gold Continuous Contract 4 Hours Chart.
Nicholas Brooks, head of research and investment strategy for ETF Securities, says the momentum looks good for gold prices, but that platinum and palladium will outshine gold in the short term.
Gold's consolidation from 1170.7 is still in progress and intraday bias remains neutral for the moment. ANother fall cannot be ruled out but downside will likely be contained by 38.2% retracement of 1084.8 to 1170.7 at 1137.9 and bring rally resumption. Break of 1170.7 will target 100% projection of 1044.5 to 1145.8 from 1084.8 at 1186 level next.
In the bigger picture, price actions from 1227.5 are treated as correction to rise from 931.3 only, no doubt. The lack of impulsive structure of rise from 1044.5 argues it's possibly part of consolidation from 1227.5, rather than resumption of the long term up trend. Hence upside will likely be limited by 1227.5 high and bring at least one more fall before the consolidation concludes. On the downside, below 1084.8 support will indicate that the third leg of consolidations has started and should then target 1044.5 again.....Comex Gold Continuous Contract 4 Hours Chart.
Brian Hicks, co-manager of the U.S. Global Investors Global Resources Fund, says long term, gold will head higher, but in the short term, prices will stay confined to a tight trading range.
The bull market inched higher during Sunday night trading, subsequently pushing gold to its best levels since December of last year. The sudden move down on Monday was a reminder that the 1160 area is an area of resistance for this precious metal.
In this new video on gold, I'll show you some of the indicators that you may want to look at in this market.
As always, our videos are free to watch and there are no registration requirements, but please share your thoughts on gold leaving a comment.
Gold was lower due to profit taking overnight as it consolidates some of the rally off March's low. Stochastics and the RSI are overbought but remain neutral to bullish signaling that sideways to higher prices are possible near term. If June extends the aforementioned rally, the 75% retracement level of the December-February decline crossing at 1184.00 is the next upside target. Closes below the 20 day moving average crossing at 1124.60 are needed to confirm that a short term top has been posted. First resistance is Monday's high crossing at 1170.70. Second resistance is the 75% retracement level of the December-February decline crossing at 1184.00. First support is the 10 day moving average crossing at 1140.00. Second support is the 20 day moving average crossing at 1124.60.
Silver was lower due to profit taking overnight as it consolidates some of the rally off February's low. Stochastics and the RSI are overbought but remain neutral to bullish signaling that sideways to higher prices are possible near term. If May extends the rally off February's low, the 87% retracement level of the December-February decline crossing at 18.893 is the next upside target. Closes below the 20 day moving average crossing at 17.550 would temper the near term friendly outlook. First resistance is Monday's high crossing at 18.605. Second resistance is the 87% retracement level of the December-February decline crossing at 18.893. First support is the 10 day moving average crossing at 18.005. Second support is the 20 day moving average crossing at 17.550.
The U.S. Dollar was lower overnight as it extends the decline off March's high. Stochastics and the RSI remain bearish signaling that sideways to lower prices are possible near term. Closes below the reaction low crossing at 80.52 would confirm that a short term top has been posted while opening the door for a possible test of March's low crossing at 79.73 later this spring. Closes above last Thursday's high crossing at 82.06 are needed to confirm that a short term low has been posted. First resistance is Monday's gap crossing at 81.01. Second resistance is the 10 day moving average crossing at 81.24. First support is Monday's low crossing at 80.22. Second support is March's low crossing at 79.73.
Gold edged higher to 1170.7 earlier today but failed to sustain gain and retreated sharply. With 4 hours MACD crossed below signal line, a temporary top should be in place and bias is flipped to the downside for some pull back, possibly to 4 hours 55 EMA (now at 1138.9). Nevertheless rise from 1084.8 is still expected to continue after the retreat and above 1170.7 will target 100% projection of 1044.5 to 1145.8 from 1084.8 at 1184.7 next.
In the bigger picture, price actions from 1227.5 are treated as correction to rise from 931.3 only, no doubt. The lack of impulsive structure of rise from 1044.5 argues it's possibly part of consolidation from 1227.5, rather than resumption of the long term up trend. Hence upside will likely be limited by 1227.5 high and bring at least one more fall before the consolidation concludes. On the downside, below 1084.8 support will indicate that the third leg of consolidations has started and should then target 1044.5 again.....Comex Gold Continuous Contract 4 Hours Chart.
Scott Redler, chief strategic officer for T3Live.com, thinks gold is looking healthy here, despite its small pullback, and he's looking for the right buying opportunity to add more shares of the GLD.
Gold was higher overnight as it extends the rally off March's low. Stochastics and the RSI are overbought but remain neutral to bullish signaling that sideways to higher prices are possible near term. If June extends the aforementioned rally, the 75% retracement level of the December-February decline crossing at 1184.00 is the next upside target. Closes below the 20 day moving average crossing at 1122.40 are needed to confirm that a short term top has been posted. First resistance is the overnight high crossing at 1170.70. Second resistance is the 75% retracement level of the December-February decline crossing at 1184.00. First support is the 10 day moving average crossing at 1136.00. Second support is the 20 day moving average crossing at 1122.40.
Silver was higher overnight as it extends the rally off February's low. Stochastics and the RSI are overbought but remain neutral to bullish signaling that sideways to higher prices are possible near term. If May extends the rally off February's low, the 87% retracement level of the December-February decline crossing at 18.893 is the next upside target. Closes below the 20 day moving average crossing at 17.502 would temper the near term friendly outlook. First resistance is the overnight high crossing at 18.605. Second resistance is the 87% retracement level of the December-February decline crossing at 18.893. First support is the 10 day moving average crossing at 17.936. Second support is the 20 day moving average crossing at 17.502.
The U.S. Dollar gapped down and was lower overnight as it extends the decline off March's high. Stochastics and the RSI are bearish signaling that sideways to lower prices are possible near term. Closes below the reaction low crossing at 80.52 would confirm that a short term top has been posted while opening the door for a possible test of March's low crossing at 79.73 later this spring. Closes above last Thursday's high crossing at 82.06 are needed to confirm that a short term low has been posted. First resistance is the 20 day moving average crossing at 81.24. Second resistance is the 10 day moving average crossing at 81.35. First support is the overnight low crossing at 80.22. Second support is March's low crossing at 79.73.
Trading can be a lot of fun and profitable or a nightmare and very costly. It really just comes down to understanding the key areas, which will make or break your trading. I have received a few emails asking me to explain more about how I stay disciplined, making sure my emotions don’t get the better of me.
Some questions asked are: How do I pick a trading strategy, which will work for me? What reading material and habits do I recommend for keeping focused? What are some of my experiences?
I will cover all this for you below because trading discipline and managing emotions is by far the most important and difficult aspect of trading.
How do I pick a trading strategy, which will work for me?
Your strategy should be inline with your abilities to read the market also focuses on a time frame, which suits the time you have available to trade each day, week or month. In other words, you should not be trading ETF options if you cannot profit from trading ETF’s without leverage. Also if you don’t understand how options work in depth, then you need to spend some time learning about this type of trading vehicle before you ever place a trade using options. Simply put, if you don’t understand everything about what you are trading, then you will eventually give all your money to the market, leaving you with an empty account, decreased trading confidence and a frustration.
The point I am trying to make here is that you should focus on trading the types of vehicles where you understand the daily price action, how to trade that investment, what makes it move, is there leverage, and what time frame you should focus on, so that it works with your schedule. If you can only look at the charts at night, after the markets close, then you should not be focusing on day trading. So pick something you like, understand or want to trade and learn everything about it. Then find a trading system or create one yourself, which is profitable using the time frame and risk tolerance that fit your personality.
Over the years my trading strategy changed, as will yours. The more time you spend trading, the better you will become the more you will find yourself trading more of one type of investment that consistently makes you money. When I started trading back in the late 90’s I focused on stocks, but as time went on, my strategy evolved and now my main focus is on trading indexes and gold with a hybrid intra-day and swing trading strategy that I created. My focus is on ETF’s, because you can select different levels of risk/reward with the 1,2 or 3x leveraged funds. While ETF’s are fantastic to trade, they do have some limitations. Because the indexes and gold trade 24/7, you are limited to only regular market hours, 9:30am – 4pm ET. That leads me to the topic of Futures and CFD trading.
Depending on the type of trade and time of day a setup occurs, I will jump from ETF’s to futures or CFD’s. Let me explain, if there is a setup early in the morning before the regular market opens, or after the close late in the evening, then I trade futures or CFD’s because it allows me to trade 24/7 catching moves which would not even be seen by most North American traders. There are not a lot of these trades per year but enough to make it worth trading.
What are some of my experiences?
In short, virtually every trader will eventually reach the tipping point. What I mean here is you will either lose enough money and/or become so frustrated that you will debate whether or not you should continue trading.
I reached this level many years ago and I still remember it crystal clear. I lost most of the money in my account, almost every trade was going against me and I had never been so frustrated and upset in my life. I’m sure many of you know what I am talking about… Unfortunately trading does break a lot of people down financial and emotionally, causing them to give up. But others reach this point and realize that if they can be wrong all the time, then someone who knows what they are doing should be making good money and that they just need to learn what they are doing.
This is the point at which you decide whether to give up a life long dream of trading full time to go back to your day job or you step back to re-evaluate your situation and seek profession help. All successful traders have or had a mentor at one point in their life and it does not matter which career you are in, learning from someone who knows how to do what you want is the fastest and most effective way to learn.
Those who decide to continue and take things serious shift their mind set from Trying To Trade to Learning To Trade. It is at this point, where trading becomes fun and profitable again. My point here is that trading is not something you can learn quickly on your own. You should get help from someone who is successfully doing exactly what you want to be doing, then shadow their every move and seek mentoring from them. This usually costs more than say just buying a book or mini e-course. There is no comparison between what you get out of them or obtaining practical experience.
What reading, and habits do I recommend for staying disciplined?
There is no easy answer, as everyone absorbs information differently. Some prefer reading and studying charts, listening to audio, watching videos and some prefer or need live mentoring and real-time examples.
I learned charting from the well known annalist, John Murphy, through his book “Technical Analysis of the Financial Markets”. This is a massive book with over 500 pages explaining technical analysis. This book is a lot to digest, but there is a lot of great free information online, which will allow you to read about the basics of trading including: chart patterns, volume, candle sticks, support & resistance levels and trend lines. Once you understand these key concepts and are able to read the charts, then you are literally ready to start paper trading and applying or creating a trading strategy, which manages entry, exits, scale out prices, and manages your money.
As most of you know, I am a very patient trader waiting for risk setups in the investments, which I understand best and have consistently traded for many years. Because of my strict trading setups and rules, which I have set for myself, it does cut down on the amount of trades the market provides. My focus is on low risk, high probability setups, which I completely understand, and that’s all I trade. This trading strategy works on any time frame allowing me to use it for day trading and swing trading.
The question everyone wants to know is how to stay so disciplined and keep emotions from taking over?
This takes me back to the Tipping Point mentioned earlier. I always ask myself if the trade meets my setup criterion, which is a simple yes or no answer because my setup criteria is clear in my head. Either it has the characteristics I am looking for or it does not. Sometimes the setups are very close and I will admit it is very tempting to take the trade, but I always step back (walk away from the computer) to clear the emotions flying around in my head and ask myself, do I want to break a rule, which almost broke me financially and emotionally once before? The answer is always No. So I pass on the trade and wait for another one to unfold.
When I was first learning to day trade, I quickly learned that I did not have to take every setup that looked like it had potential. I realized that no matter what condition the market was in, there would always be another trade just around the corner, so its not a big deal. I admit, I hate to see an investment make a large move without me like this 7 day rally in gold happening right now, because my setup criteria was not met. But I know there will be many more trades through the year in gold and other investments, which will provide me with great returns. People who think they need and must catch ever big move in the market in order to make big money on yearly basis, are looking that things completely backwards. It only takes 5-10 good trades per year to out perform the market so I don’t understand people when they panic about every zig and zag the market makes.
Ok, lets take a look at the gold chart, which I have overlaid with two cycles, which I use to help time gold.
9 Day Gold Cycle
The daily chart of gold below has my 9-day cycle overlaid. You can see how this cycle relates to the price movements of gold. After the recent low cycle, we saw gold continue to move higher and this is because the trend of gold turned up in March and the long term cycle is also moving up at the same time. These two bullish forces can over power the short term 9-day cycle at times.
That being said, the 9 day cycle will be topping in 2 days (Tuesday) and that should put some selling pressure on gold. I expect to see a pullback or consolidation (sideways movement) in the coming week.
29 Day Gold Cycle
This cycle allows us to see the big picture and underlying trend for gold. This larger more powerful cycle of gold will top in one day (Monday) and that should put a damper on this rally. You can see how I think gold will play out from the lines on the chart.
Combined Cycles on Gold
This chart clearly shows how both cycles will top this week which should put some selling pressure on gold and silver and one of the reasons I have not chased the price of gold higher buying in a panic.
Gold Trading Discipline Conclusion:
In short, trading discipline is something you can become educated about from books, but the only way to actually take control of your trading, is to be honest with your self. Think of it this way, every time you break a trading rule, you are setting yourself up for failure. Do you really want to sabotage the most important person in your life, which you will have to live with every day (You)? If you cannot trust yourself from sabotaging and lying to your self, what type of person would you be? Do you want to lose money by taking positions, which are proven not to work and cost you money in the long run? Of course you don’t!
So the next time you see a trade, which is close to your setup but no exactly what you are looking for, just walk away and wait for the next one.
As for the current price of gold, I think we are about to see lower prices, or at least a pause, which will last for 5-15 days.
Gold's rise extended further to as high as 1165.3 last week and the break of 1163 resistance confirmed the case that fall from 1227.5 is already finished with three waves down to 1044.5. Rise from 1044.5 is treated as the second leg of the consolidation from 1227.5 and should now target 100% projection of 1044.5 to 1145.8 from 1084.8 at 1184.7 next. On the downside below 1144.0 minor will turn intraday bias neutral and bring retreat. But downside should be contained well above 1084.8 and bring another rise.
In the bigger picture, price actions from 1227.5 are treated as correction to rise from 931.3 only, no doubt. The lack of impulsive structure of rise from 1044.5 argues it's possibly part of consolidation from 1227.5, rather than resumption of the long term up trend. Hence upside will likely be limited by 1227.5 high and bring at least one more fall before the consolidation concludes. On the downside, below 1084.8 support will indicate that the third leg of consolidations has started and should then target 1044.5 again.
In the long term picture, rise from 681 is treated as resumption of the long term up trend from 1999 low of 253 after interim consolidation from 1033.9 has completed in form of an expanding triangle. Next long term target is 100% projection of 253 to 1033.9 from 681 at 1462 level. We'll hold on to the bullish view as long as 931.3 structural support holds.....Comex Gold Continuous Contract 4 Hours Chart.