We focus on Gold, Oil, Silver, Index & Sector ETFs. When following our technical analysis and proven ETF trading strategy, trades become very clear and simple to execute
Gold dropped sharply to as low as 1155.6 last week but recovered strongly since then. Initial bias is neutral this week and we'd expect some consolidations above 1155.6 first. But still, upside should be limited by 1203.9 resistance and bring fall resumption. Break of 1155.6 will target 1124.3 support next. However, above 1203.9 will indicate that a short term bottom is formed. In such case, lengthier consolidation would be seen before decline from 1266.5 resumes.
In the bigger picture, gold's rally from 1044.5 should have completed at 1266.5. More importantly, whole medium term rise from 681 might have finished with five waves up too, on bearish divergence condition in daily MACD. Sustained trading below 55 days EMA (now at 1197.6) affirms this case. Deeper correction should now be seen to 1044.5 cluster support (38.2% retracement of 681 to 1266.5 at 1042.8) at least. After all, even in case of strong rebound, we'd maintain that risk remains heavily on the downside as long as 1266.5 high holds.
In the long term picture, we're proposing that 1266.5 is an important medium term top in gold and we should see a sizable correction going forward. A breach of 1000 psychological level is possible. However, there is no indication of long term up trend reversal yet. We'd maintain the long term bullish view and expect whole up trend from 1999 low of 253 to continue to 100% projection of 253 to 1033.9 from 681 at 1462 level after completing the correction from 1266.5.
Most traders I have been talking with are feeling the same thing. Something big is brewing for the equities market but most do not want to get heavily involved until there is a clear direction. The broad market has been consolidating for almost 3 months and it’s important to remember that the larger the consolidation the bigger the move.
Also the biggest and best moves come from failed patterns. So is the big head & shoulders pattern on the SP500 which everyone is yelling about (the sky is falling) really going to happen or is this the BIG fake out? Only time will tell, either way no matter which way it goes I will be sure to catch some of it.
Below area few charts pointing out patterns and trends which could provide some opportunity in the coming days or weeks.
XLF – Financial Sector ETF
Financials play a large roll in moving the major indexes so if this reverse head and shoulders patter breaks out to the upside then the indexes should rally and XLF etf could reach its measured move of $16.50.
USO – Crude Oil Fund
Crude oil almost looked like it was going to breakout and mover higher this week but sellers jumped in sending it lower once again. The daily chart shows a large bearish pennant which is known as a continuation pattern. So it looks as though we should see lower prices for oil.
GLD – Gold Bullion ETF
Gold has been sliding lower for several weeks now and it looks to be showing selling exhaustion. The 5th wave down with the volume spike indicates panic selling as investors cannot hold onto those positions any longer and exit. This is a bullish sign for gold. Also we are seeing gold fall deep into a support level along with the 200 day moving average.
Mid-Week Financial, Oil and Gold Trading Conclusion:
In short, the equities market is in limbo until a clear trend is established. If the financial sector breaks out to the upside then we should see a sizable rally. As for oil it looks to be trading in near the middle of its range but is still in a down trend overall. Gold is almost looking ready for a bounce but I am waiting for more confirmation before jumping on the wagon.
The second half of last week we saw some strong price action in the equities market. The SP500 broke through the 5 and 50 day moving averages closing the week just under key resistance levels. The SP500 futures will find resistance at the June high $1099.25, $1100 which is whole number then at $1103 which is the 200 day moving average. Each of these are clumped together making it really just one solid area which sellers will be waiting to short the market.
The market momentum and internals are looking strong for the equities market overall. With last weeks strong close we have seeing the percentage of stocks closing above their 50 and 200 day moving averages surge from 40% to 68% from the previous week. Stocks closing above their 20 day moving average jumped from 40% to 82% from the previous week. Seeing this type of shift in the market Momentum is generally a bullish indicator.
From a quick glance at the internals it looks as though Monday will trade flat/negative for the session. Reason being is that the NYSE Advance/Decline line is telling us the market is overbought when looking at a short term time frame. I would expect some selling Monday or possibly we get a gap up, then a sell off early in the session while the market digests last weeks strong closing.
Gold
Bullion has been giving mixed signals for while now. It looks like there has been a possible ABC retace, but on the other hand it looks to be forming a stair step pattern lower (series of bear flags). Until we get something more concrete from the charts lets just keep our eye on it for now.
Crude Oil
The past month we have seen oil form a bear flag which generally leads to lower prices. That said oil continues to grind its way higher closing at a key resistance level. This could be a possible double top before heading lower or we could get a breakout and rally this week. I know that does not sound helpful but remember oil is very sensitive to weather (hurricanes), US Dollar and geopolitical events making it much more unpredictable than one may think. That said I am not trading it right now.
Pre-Week Trading Warm Up
I feel the equities market has some strength behind it. But we must see the SP500 futures contract close strongly above the $1103 area. With the market overbought and trading at resistance I am favoring some early weakness Monday
As for the gold and oil, I am just going to keep an eye on them. I’m just not feeling/seeing the patterns which I find tradable at the moment for a low risk setup.
Quick Trading Tip: I try to always analyze and trade the market the way which has always worked for me. Keeping my emotions in control and filtering out as much news, events and opinions as possible so I can think clearly while I focus on my low risk setups. The past couple months have had big news and events unfolding making it harder for traders to stay focused. It is crucial for traders to step back and clear their heads from all the news, hype and opinions shared across all the mediums and just look at a simple chart analyzing the price, volume and trend.
It would appear that the euphoria over gold has quickly diminished and many of gold's greatest proponents, who were calling for gold to go over $2,000 an ounce, appear to be disheartened and shell shocked by the recent sharp downturn in gold.
There's an old adage in trading and it goes like this, "they slide faster than they glide." This is true of all markets and what it means is they go down faster than they go up.
In our new video on gold, we share with you some of the thoughts we have right now on this market. We could be looking at some great buying opportunities if just a few components fall into place.
As always there is no charge and no registration required to watch this video.
Gold closed lower on Monday and below the 38% retracement level of this year's rally crossing at 1183.90. The low range close sets the stage for a steady to lower opening on Tuesday. Stochastics and the RSI are diverging but turning bearish again signaling that sideways to lower prices are possible near term. If August extends the decline off June's high, the reaction low crossing at 1168.00 is the next downside target. Closes above the 20 day moving average crossing at 1217.90 are needed to confirm that a low has been posted. First resistance is the 10 day moving average crossing at 1199.80. Second resistance is the 20 day moving average crossing at 1217.90. First support is today's low crossing at 1176.90. Second support is the reaction low crossing at 1168.00.
Silver closed lower on Monday as it extends the decline off June's high. The low range close sets the stage for a steady to lower opening on Tuesday. Stochastics and the RSI are diverging but turning bearish again signaling that sideways to lower prices are possible near term. If September extends the decline off June's high, June's low crossing at 17.230 is the next downside target. Closes above the 20 day moving average crossing at 18.289 are needed to confirm that a low has been posted. First resistance is the 10 day moving average crossing at 17.999. Second resistance is last Thursday's high crossing at 18.535. First support is today's low crossing at 17.440. Second support is June's low crossing at 17.230.
Copper closed higher due to short covering on Monday and the mid-range close sets the stage for a steady opening on Tuesday. Stochastics and the RSI have turned bearish signaling that sideways to lower prices are possible near term. Closes below the reaction low crossing at 285.55 would confirm that a short term top has been posted. If September renews this month's rally, the reaction high crossing at 312.30 is the next upside target. First resistance is the reaction high crossing at 307.05. Second resistance is the reaction high crossing at 312.30. First support is today's low crossing at 292.50. Second support is the reaction low crossing at 285.55.
The S&P 500 index closed higher due to short covering on Monday as it consolidates some of last Friday's decline. The high range close sets the stage for a steady to higher opening on Tuesday. Stochastics and the RSI are overbought but remain neutral to bullish signaling that sideways to higher prices are possible near term. If September extends this month's rally, June's high crossing at 1129.20 is the next upside target. Closes below last Friday's low crossing at 1059.30 would confirm that a short term top has been posted. First resistance is last Thursday's high crossing at 1099.00. Second resistance is June's high crossing at 1129.20. First support is today's low crossing at 1057.10. Second support is this month's low crossing at 1003.10.
It was an interesting options expiration week for equities that’s for sure. We saw some very choppy price action with large waves of buying and selling as the bulls and bears fought for control.
Both Gold and Oil closed lower for the week which is not a good sign considering the US Dollar dropped like a rock along with them. Below are a few of my charts
GLD – Gold ETF Price Action
Gold continues to pull back from the June highs. It looks as though it could form an ABC retrace pattern if the July 7th low is broken. If $1085 is broken we should see gold drop to $1065-75 level. On the GLD etf that would be around the $112.50 – $113.50 level. That should shake out the majority of weak positions and start to rally towards the $1250/60 level.
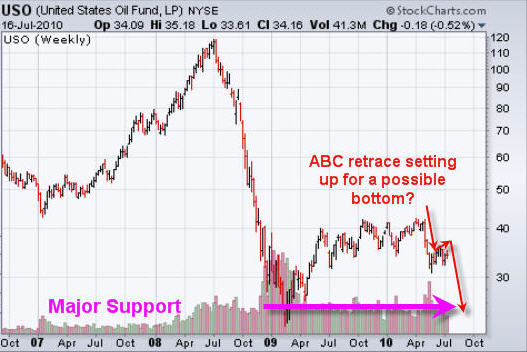
Crude Oil – USO Oil Fund
This is a weekly chart of oil which clearly shows how selling volume has risen and the trend since 2009 has gone up, sideways and is now heading back down. The bear flag forming on this weekly chart looks about ready for another leg down. Once that occurs we could see a test of the 2009 lows.
Using some "inter market" analysis crude oil tends to move in the opposite direction of the US Dollar. From a quick glance at the dollar chart is looks about ready to bounce which will send oil sharply lower. It will be interesting to see how this unfolds over the next 2-3 weeks.
SP500 – SPY Index Fund
Friday we saw some the SP500 sell off on heavy volume after testing its 50 and 200 day moving averages which are key levels for trading and investors to take profits or add to their short positions in hope for another multi day sell off.
That being said, there is still a good change of higher prices and for all we know this could be the start of another multi month rally. While I am more inclined for us to play the down side this week I will not have a problem taking a long position if we start to see the market internals and breadth improve alone with bullish price action. I monitor the 60, 30 and 10 minute charts which allow me to get a feel for the overall short term trend and strength.
Weekend Trading Conclusion:
Overall it looks like we could have a couple more days of weakness for stocks and commodities. The US Dollar is very much oversold and as of this writing it looks like its starting a small bounce. A rising dollar tends to put downward pressure on gold and oil along with the large multi national companies.
Equities sold off Friday with a slow grind down from 9:30 -4pm never putting in any type of bounce when looking at the 60 minute chart. The SP500 and other indexes are way over sold after Friday and I am expecting some follow through Monday as investors review the charts over the weekend and see what happened on Friday. That should cause another wave of selling in the morning as traders panic out of positions.
It’s going to be an exciting week for sure!
If you would like to receive Chris Vermeulen's trading analysis and trade alerts be sure to checkout The Gold And Oil Guy .Com.
"Battle tested" trading veteran Adam Hewison and his team are allowing me to offer you TWO complimentary weeks of their service so you can see how much it can truly help your trading.
Gain access to Marketclub’s multifaceted system including analysis, training videos and his proprietary signal system here.
Their arsenal of tools and unique indicators can really help you establish the overall trend of 320,000 tickers quickly and easily for many different time frames and trading styles.
On top of that, their customer support team is LIVE and readily available throughout your trial to help you navigate their service...
* How to use the 'Smart Scan' feature to help you find your next trade
* How the 'Trade Triangles' will tell you when to pull the trigger on a trade
* How "Instant Alerts' will keep you ahead of any unexpected moves (and send you an email if your ticker crosses over certain 'parameters' as well)
* How to access their dedicated customer support team (they can explain all of the features of the system and walk you through it online OR on the phone).
This offer won’t be live for long don’t miss your chance to test drive one of the greatest values in trading while it lasts.
*Don’t forget to sign-up for Thursdays webinar. Just look for the link to register in the email with your log in information to MarketClub. The staff will show you exactly how to use the service, and you can ask questions and interact with other MarketClub users to get the full experience.
Crude oil edged lower to 71.09 last week but formed a short term bottom and recovered. Further rise might be seen initially this week but we'd expect upside to be limited by 79.38 resistance and bring fall resumption. At this point, we still favor that case that choppy recovery from 64.23 has completed at 79.38 already. Below 71.09 will target a retest on 64.23.
In the bigger picture, recovery from 64.23 is treated as a correction to fall from 87.15 and has possibly completed at 79.38 already. Break of 69.51 will indicate that decline from 87.15 is likely resuming. This will also revive the bearish case that whole medium term rise from 33.2 is finished at 87.15, just ahead of 50% retracement of 147.27 to 33.2 at 90.24. In such case, we'd see another fall to 50% retracement of 33.2 to 87.15 at 60.18 at least.
In the long term picture, current development suggests that rebound from 33.2 is finished at 87.15, inside 76.77/90.24 fibo resistance zone as expected. Our view is that fall fro 87.15 would develop into the third falling leg of the whole correction from 147.27 and hence, we'd anticipate an eventual break of 33.2 low in the long term as such correction extends.....Nymex Crude Oil Continuous Contract 4 Hours Chart
This market has surprised many people as they were expecting gold to continue up to the $2000 level without any problems. Normally when you have such the unanimous viewpoint, the markets tend to go the other way. The reason for this is that everyone who is bullish is normally long the market. The current breakdown in the yellow metal has not changed the overall longer term bullish trend for this market.
The question is, how far will the gold move to the downside, and where is support? In this new video we point out some very positive signs as well as some troubling aspects that we see in this market.
This is a video we think you will get a lot out of and as always you are free to watch it without registration. We hope that you have the time to leave us a comment about this video and share your thoughts on the gold market.
Will Rhind, head of U.S. operations at ETF Securities, says gold's recent correction will create a buying opportunity and that gold is still investors' favorite metal.
In today's short video, we look at two important aspects of the market, one is an intraday technique which I will show you how to use to determine where markets will turn, and the other is the infamous "death cross".
The death cross does not occur that often, in fact, in the last 2 1/2 years we've only seen this happen three times. The most recent occurred just last week and is something that every investor and trader should pay close attention to. I believe that this video will help you understand what the death cross is and how you can construct it and use it in your own trading. A lot of traders and investors watch this very closely so you should too.
As always our videos are free to watch and there's no need for registration. Please feel free to leave a comment and give us your thoughts on the direction of this market.
The gold market has had a lot of publicity and been under intense scrutiny lately as investors, both conservative (Glenn Beck) and liberal (George Soros), are weighing in and recommending a position in gold.
Certainly the trend in gold remains positive, however there are some possible early chinks in the gold armor that I want to bring to your attention in this short video.
We invite you to watch this video with no strings attached and to leave us a comment on this popular market.