Showing posts with label earnings. Show all posts

Wednesday, July 25, 2012

How To Position Yourself for a 10 Year Pattern Breakout

As mentioned last Friday just before things took a dive on the weekend, a look at the major market indices did not look promising. If we take an even longer term look and examine the monthly charts we can see that The S&P 500 as well as the Dow Jones have been approaching multi decade rising channel resistance lines. Further, they also appear to be forming bearish rising wedge patterns.

Monthly Long Term Chart Analysis & Thoughts....
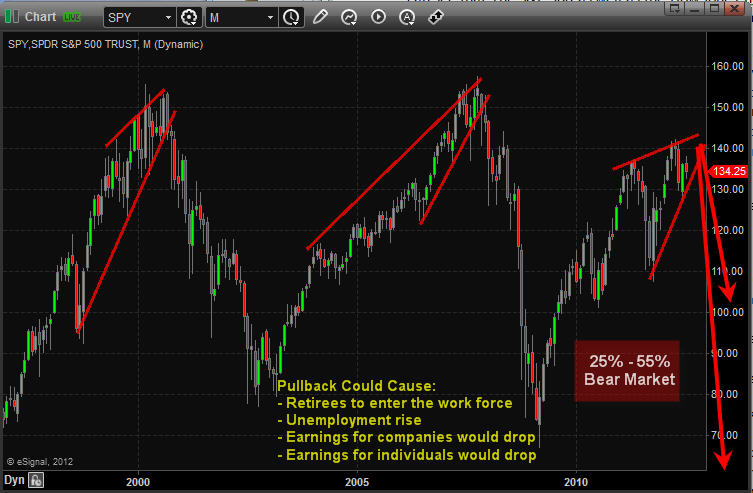
As many of my longer term subscribers can attest to, I always preach that technical analysis is one part art and one part science: you can never be completely certain on what the outcome of a pattern is going to be. However, we can use historical analysis to make better investments. The great American Novelist Mark Twain probably said it best in that “history does not repeat itself, but it rhymes”. Regarding a rising wedge pattern, we know that roughly two thirds of the time they will break to the downside. This also means that one third of the time they break to the upside.

In accomplishing our goal of capital growth we must do a number of things. We must make returns on our investments, we must protect our investments, and we must limit our losses. While all three aspects work in tandem with each other, there are times when focus must be allocated to one specific approach.

Regarding the current technical setup, I’m not so focused on the 67% chance that these wedges will break to the downside, but more so the impact of each outcome on the average Joe’s portfolio and mom and pop businesses. The S&P 500 and the Dow are approaching long term resistance lines that have been in place for decades. If we do break to the downside, which I suspect we will, there could be a very significant sell off with consequences that no one can predict at this point though I mention some things in the chart above. Alternatively, there is significant overhead resistance in the various indices, and I don’t believe an upside break would be too monumental.

That being said, I always like to keep an open outlook and wait for the right opportunity. I’m trying to think of scenarios that would prelude further upside action and I really am not coming up with much. As evidenced by the completion of the recent 5 wave uptrend on the S&P that coincided nicely with the various quantitative easing policies, Ben Bernanke and the fed have had less and less impact. I truly can’t see many fiscal developments that would prompt any significant bullish action.

The only scenario I really think that could pump up equities is a series of positive earnings announcements. A lot of expectations, earnings numbers, guidance, etc… have been revised downwards over the last couple of quarters, so there is the opportunity for some positive surprises that could lead to some bullish price action. In absence of such a scenario, I really can’t think of much else that would prompt a run up.

Look at these charts of positive and negative earnings surprises… and the dates and remember what happened following this negative data....

Positive Earnings Surprise


Negative Earnings Surprise


That being said, I am recommending two courses of action. For those steadfast bulls, lock in some profits and/or buy some protection. Missing out on some of the upside is a lot better than losing some of the gains you have fought so hard for over the past couple of years. For the more aggressive traders and investors, start following my updates a little more regularly as I foresee many shorting opportunities coming up in the future. As many of you know, sell offs are often quick and abrupt, and timing is extremely important when playing the downside.

Further, trading could get very volatile in the near future. Historically, and even more so looking forward as August and September have been very costly for the average investor. Our focus will be in taking the highest probability trades that offer the best risk to reward scenarios. There will be times when we miss trades, and times when they’re not timed perfectly. But, as those who have been with me for a while can attest to, patience pays off in the long run....

Join my Free Market Analysis & Trade Idea Newsletter > Now at The Gold & Oil Guy

Chris Vermeulen

Get our Free Trading Videos, Lessons and eBook today!

Wednesday, October 19, 2011

The SP 500, Apple Earnings and Feeding The A.D.D. Monster


The last hour of trading was intense on Tuesday and then all eyes were focused on Apple’s earnings which were released around 4:30 ET. The initial reaction to the earnings release is negative although as I write this AAPL is bouncing sharply higher in after market trading on strong volume.

To put the final hour’s volatility into perspective, at 3 P.M. Eastern Time the S&P 500 Index was trading at 1,217. A mere 12 minutes later the S&P 500 Index pushed 15 handles higher to trade up to 1,232. Then sellers stepped in and pushed the S&P 500 lower by nearly 12 handles in the following 20 minutes.

The price action was like a roller coaster and I was sitting watching the flickering red and green bars in real time with the anticipation of a child. It was the most excitement I have had in quite some time, but please don’t hold that against me. I don’t know whether reading my previous line makes me laugh or cry, but the truth must be heard I suppose.

Enough self deprecation, I want to get down to business with some charts and what is likely to happen in coming sessions. The sell the news event in AAPL has the potential to really change the price action tomorrow. If prices hold at lower levels, the indices could roll over sharply tomorrow. The S&P 500 E-Mini futures contracts are showing signs of significant weakness after the earnings miss by Apple in aftermarket trading.

Some other potentially game changing news items came out of Europe where Reuters reported earlier today that the Eurozone will likely pass legislation that will ban naked CDS ownership on sovereign debt instruments. Additionally, Treasury Secretary Timothy Geithner stated this morning that a forthcoming FHA announcement involving a new housing refinance plan was going to be made public in coming days. The statement regarding the new FHA plan helped the banks and homebuilders show relative strength during intraday trading and likely were behind much of the intraday rally.

I would point out that the S&P 500 Index (SPX) broke out slightly above the August 31 highs before rolling over. The reason that is critical is because the S&P 500 E-Mini futures did not achieve a breakout, but tested to the penny the August 31st highs. I am going to be totally focused on tomorrow’s close as I believe it will leave behind clues about the future price action in the S&P 500 leading up to option expiration where volatility is generally exacerbated. The daily chart of the S&P 500 Index is shown below:


If Wednesday’s close is below the recent highs near 1,230 we could see this correction intensify. The price action on Tuesday helped stop out the bears and if we see a significant reversal tomorrow the intraday rally today will have been nothing more than a bull trap. The price action Tuesday & Wednesday could lead to the perfect storm for market participants where bears were stopped out and bulls are trapped on the potential reversal.

Another interesting pattern worth discussing is the head and shoulders pattern seen on the SPY hourly chart. The strong rally to the upside may have indeed negated the pattern, but if prices don’t follow through to the upside in the near term and the neckline of this pattern is broken to the downside we could see serious downside follow through. The hourly chart of the Spider SPY Trading ETF is shown below:


Ultimately there are two probably scenarios which have different implications going forward. The short-term bullish scenario would likely see prices breakout over recent highs and push higher toward the key resistance area around the 1,260 price level. The 1,260 price level corresponds with the neckline that was broken back in August that led to heavy selling pressure.

Bullish Scenario
If we do breakout to the upside, the longer term ramification may wind up being quite bearish as most indicators would be screaming that price action was massively overbought at those levels and a sharp selloff could transpire into year end. The daily chart of the S&P 500 Index illustrates the bullish scenario below:


Bearish Scenario
The short term bearish scenario would likely involve a break below Monday’s lows that would work down to around the 1,140 level or possibly even lower. If a breakdown took place, a higher low could possibly be carved out on the daily chart which could lead to a multi month rally that would likely see the neckline mentioned above tested around the holiday season. The daily chart of the S&P 500 below shows the bearish scenario:


There are a variety of reasons why either scenario could unfold. Most of the analysis that I look at argues that the bearish scenario is more probable. However, based on what happened in the final hour of trading on Tuesday and the surprise earnings miss from Apple anything could happen.

I will likely wait for a confirmed breakout either to the upside above recent highs or to the downside below the neckline of the head and shoulders pattern illustrated above before accepting any risk. I am of the opinion that risk is exceptionally high in the near term. I am not going to try to be a hero, instead I am just going to wait patiently for a high probability setup to unfold.

Until a convincing breakout in either direction is confirmed, I am going to sit on the sidelines. I am quite content just watching the short-term price action without taking on any new risk. For those that want to be heroes or feel they have to trade, I would trade small and use relatively tight stops to define risk. Risk is excessively high!

Subscribers of OTS have pocketed more than 150% return in the past two months. If you’d like to stay ahead of the market using My Low Risk Option Strategies and Trades check out OTS at Options Trading Signals.Com and take advantage of our free occasional trade ideas or a 66% coupon to sign up for daily market analysis, videos and Option Trades each week.

JW Jones

Get J.W.s Latest Options Trading Signals Articles