Thursday, July 12, 2012

Gold Cycles Will Soon Forecast Where Prices Are Headed

Gold and stock market forecaster have been using cycles in price that repeat every certain amount of trading days to help them spot key reversal areas in the financial market. Almost everything in life seems to go in cycles and commodity prices and the stock market are no different.

As we all know the market is very difficult to forecast when using only one set of analysis like cycles. Analyzing price action, volume, market sentiment, market breadth, trends and inter-market analysis are the other key areas which one must understand before they can be in the zone (ZEN) with the financial market and properly forecast future prices.

This report will show you just how well cycles work if applied and traded properly.


The chart below is of gold and shows its short term trading cycles. I will admit this chart is hard on the eyes and as ugly as they get to bear with me.

Three different cycles have been applied to the chart using a short, intermediate and long term cycle wave length. The general idea here is that you want to trade with the underlying trend, then use these short term cycles to profit from weekly price swings.

Gold has been in a down trend for a year so the focus should be on shorting the bounces. Focusing on selling short gold during a time with 2 or more cycles are topping as you stand a great chance of the price moving in your favor within 1-3 days.

Once the price starts to move in your favor you want to scalp to profits once the short term (green) cycle drops near a reversal level. Once this takes place I always tighten my stops to breakeven, lock in some profits and continue to wait for another cycle to reach the bottom at which point I take more profit off the table and tighten my protective stop once again.

As you can see this is not the perfect system but it makes money, and if you apply more analysis to the market you can lock in more of these moves using intraday charts, volume, and sentiment levels.


How to Find Market Cycles
You must have an analysis tool that can read the market and find cycles within it. Once you know how many days the most frequent cycles are occurring you can then use a custom cycle indicator to overlay them on the charts as seen in the gold chart above. The visual overlay is the key to spotting market reversals and areas to add to a position or trim profits. Look at the chart below for a visual of how I find my cycles.


Gold Cycle Forecast Conclusion:
In short, gold overall remains in a down trend. But from looking at the gold chart and its short term cycles I have a feeling we will be seeing price trade sideways this week and a bounce next week.
The next week will be very interesting as these cycles will actually give us an early warning if the overall gold market is about to bounce or sell off. The question is what the cycles do in the next few days while gold flirts with support…

It does take some time/experience to read the cycles and get a feel for how they move so don’t worry about it if you don’t fully grasp the idea from this short article. 

Find out more on cycles and trading at The Gold & Oil Guy.com

Monday, July 9, 2012

Here's Our "Accurate" Stock Market Predictions on the Next Major Move

The term Stock market predictions is a very controversial topic and does seem to give off a negative/non-credible overtone to most traders, investors and the general public. We all know you cannot predict the market with 100% certainty, but knowing that you can still predict the market more times than not if done correctly. Keep in mind that the term “market prediction” is also known as a market forecast or technical analysis outlook and is nothing more than a estimated guess of where the price for a specific investment is likely to move in the coming minutes, hours, days, weeks and even months.

Getting back on topic, this report clearly shows how the US dollar plays a dominant role in the price of other investments. Understanding how to read the Dollar Index will make you a better trader all around when trading stocks, ETF’s, options or futures.

SP500 Stock Market predictions – 10 Minute Chart:

These charts clearly show the inverse relationship between the stock market and the dollar index. Knowing how to read charts (candle sticks, chart patterns, volume etc…) is not enough to give you a winning edge. You must also understand inter-market analysis as all markets are linked together in some way and the dollar plays a major role in where stock prices will move next. Review the charts and comments below on how I came up with my stock market prediction and trade idea.


Gold Market Prediction – 10 Minute Charts

Gold is another investment which is directly affected by the price of the dollar. Review charts for more details.


Long Term Stock Market Forecast:

The weekly dollar chart is VERY IMPORTANT to watch as a short term trader and long term investor because trend changes in the dollar means you open positions will also likely change direction.

So, if we apply technical analysis to the dollar chart as seen below. You will notice we are able to create a market forecast and predict roughly where price is likely to move and how long it should take to get there. If the dollar can break above the red resistance level then we can expect a rally for 4 – 8 weeks and a price target around the 87-88 level.

If this is the case then stocks and commodities would likely do the inverse price action and move lower, sharply lower…


Stock Market Predictions & Gold Market Forecast Conclusion:

In short, the next weekly candle stick on the dollar chart could be a game changer for those who are long the overall stock market.

I will admit that the current market conditions are not easy to trade because of all the headline news rolling out of Europe each week along with economic data. And I feel as though we have been tip toeing through a mine field for the past 12+ months waiting for extremely negative news are extremely positive news to trigging a wave of buying or selling that will make our jaw drop, but it has yet to happen. Remember always use stops and don’t get over committed in a headline driven market.

If you would like to receive my free weekly analysis like this, be sure to opt-in to my list. 

Monday, July 2, 2012

Don't Miss our Holiday Special....Ends July 6th at Midnight!


Ready for the next market move?  Click Here for this weeks Special

Beat the street with our low risk ETF trading signals

Member Benefits Include

Low risk ETF trades
Entry, Target and Stops
Holding times 2 to 30 days
Position Money Management
Intraday Market Updates
Special Sector Analysis
Educational Trading Videos
Trading Guide
Unlimited Email Support
401K, IRA and RSP Tradable
Alerts Via Web and Email


Just remember to enter code july12for6
to get the 12 membership for the price of 6 months


Friday, June 22, 2012

Gold Still at Risk of a Large Downward Move Before the Rally

Gold has been busy consolidating in what I believe will be a 13 Fibonacci month Primary wave 4 correction. The Gold bull market I’ve been following since 2001 is a likely 13 year bull cycle that will end in 2013 or 2014 depending on how you count. This current correction pattern is working off a 34 Fibonacci month rally that took Gold from 681 to 1923 at its ultimate highs. Last fall I warned about the parabolic run likely ending in the 1908 ranges and for investors to position themselves accordingly.

Today we have Gold trading around 1600 and our recent forecast in May was for a rally into Mid June topping around 1620-1650 ranges in US Dollars. The intermediate forecast still calls for a possible drop to 1445-1455 ranges this summer, the same figures I gave out on TheStreet.Com interview last September for a Primary wave 4 low.

Only a close and a strong move over 1650 will eliminate the downside risk in my opinion. Below we can see a weekly chart showing the 34 week moving average line as well as the obvious downtrend line. The 34 week moving average line acted as support during the Primary wave 3 rally from 681-1923. It now is acting as a resistance ceiling to break through, and I don’t think we will until this fall. The likely cyclical lows for this Gold correction will be in the October window and investors should make sure they are positioned long by that time.

Subscribe to our regular updates to stay informed on a dialy basis on the SP 500 and GOLD in the meantime with a discount offer. Go to Market Trends Forecast.com to sign up or to ask for our free weekly reports.


Wednesday, June 20, 2012

Gold and Silver on the Verge of Something Spectacular

Gold and silver have taken more of a back seat over the past 12 months because of their lack of performance after topping out in 2011. Since then prices have been trading sideways/lower with declining volume. The price action is actually very bullish from a technical standpoint. My chart analysis and forward looking forecasts show $3,000 ish for gold and $90 ish for silver in the next 18-24 months.

Now don’t get too excited yet as there is another point of view to ponder....

My non technical outlook is more of a contrarian thought and worth thinking about as it may unfold and catch many gold bugs and investors off guard costing them a good chunk of their life savings. While I could write a detailed report with my thinking, analysis and possible outcomes I decided to keep it simple and to the point for you.

Bullish Case: Euro land starts to crumble, stocks fall sharply sending money into gold and silver which are trading at these major support levels which in the past triggered multi month rallies.

Bearish Case: Greece, Spain and Italy worth through their issues over the next few months while metals bounce around or drift higher because of uncertainty. But once things have been sorted out and financial stability (of some sort) has been created and the END OF THE FINANCIAL COLLAPSE has been avoided money will no longer want to be in precious metals but rather move into risk on.

Take a look at the gold and silver charts below for an idea of what may happen and where support levels are if we do see money start to rotate out of metals in the next 3-6 months.

Gold Forecast
Silver Forecast
Over the next few months things will slowly start to unfold and shed some light on what the next big move is likely going to happen to gold and silver.

The price movements we have seen for both gold and silver indicate were are just warming up for something really big to happen. It could be a massive parabolic rally to ridiculous new highs in 2012/2013 or it could be a huge unwinding of the safe havens as countries sort out their issues and the big money starts moving out of metals and into currencies and stocks.

Only time will tell and that is why I analyze the market multiple times per week to stay on top of both long term and short term trends.

To keep up with Chris Vermeulen and his thoughts on current trends and trades for gold, silver, oil, bonds and the stocks market checkout The Traders Video Playbook


Get our Free Trading Videos, Lessons and eBook today!

Monday, June 18, 2012

Gold Chart of the Week

After completing a solid week of gains, the August Gold futures awaited the outcome of elections in Greece. Sunday night brought positive news early after the Greek vote was finalized, but the euphoria wore off quickly following news in Spain regarding high borrowing costs and bad loans that plague the future of the Spanish economy. Traders were buyers in most sectors early in the overnight session, then heavy sellers as we near the open of the US equity markets. The US Dollar and the Euro have already traded in very wide ranges over the last few hours.

Now that the Greek vote has passed, traders will look for clues this week from Los Cabos, Mexico where representatives from the G20 summit are in session to discuss the European issues that have affected the market so heavily over the last few months. Additionally, the US Fed will meet this week and deliver a policy statement that some traders hope will hint to some form of easing.

Gold traders that have defended long positions or added to their long positions last week are hoping for supportive language from the G20 Summit coupled with US Fed participation to keep Gold underpinned.


The chart above shows the daily chart of August Gold futures. I pointed out the Gold’s recovery last week after a two thirds retracement from the $1642 high. A good sign for Gold came three trading days ago when it closed above the overhead resistance trendline (in blue) that had been Gold Bugs nemesis for months. In early May and early June, the futures closed above the same line, but only for one day before sinking below again the very next day. Closing above this trendline for multiple days is a good start for technical traders that are bullish, but I believe they will be much more comfortable if prices can carve out a new high and close above $1642 an ounce.

I also pointed out that last night’s selloff ran into firm support at the same trendline that was once resistance. You can see that today’s low never broke the line and indicates that Gold prices are still poised to continue last week’s rally. Until the Gold prices close below this proverbial “line in the sand”, I believe traders will continue to hold long positions and or buy pullbacks. This will not be an easy trade for Gold buyers if the Euro maintains this type of weakness and drives the US Dollar higher, but this week’s news can provide the catalyst that will bring Sunday night’s early euphoria back to the trade.

Overall, I still believe that the market will see higher Gold prices throughout this year. My bias is based more on the fact that global economic woes coupled with massive amounts of new currencies being printed around the world, should provide “flight to safety” traders enough reasons to maintain bullish positions in Gold. On a day to day basis, especially over the next week or two, we should expect continued volatility as the world awaits very important global economic news. Once this news is final, I expect a more predictable trade.

Posted courtesy of Gold ETF Family member Brian Booth and INO.Com

Monday, June 11, 2012

What's Next Now That Mondays Precious Metals and Equity Prices are Marked UP!

The past couple months have been a roller coaster ride for investors and traders. Overseas headline news has made investing and trading more difficult than normal because of prices gaping up or down at the opening bell several times per week. The next two weeks are going to be even crazier because of the Greek election and Spanish bank bailout.
This past weekend it looks as though the Spanish banks are getting bailed out which will be similar to the 2008 – 09 bailout we saw in the United States. This news has marked up stocks and commodity prices during overnight trading Sunday. The major indexes are up 1-2% across the board.
Looking at the technical and sentiment this is what I feel will take place and how it can be attacked…
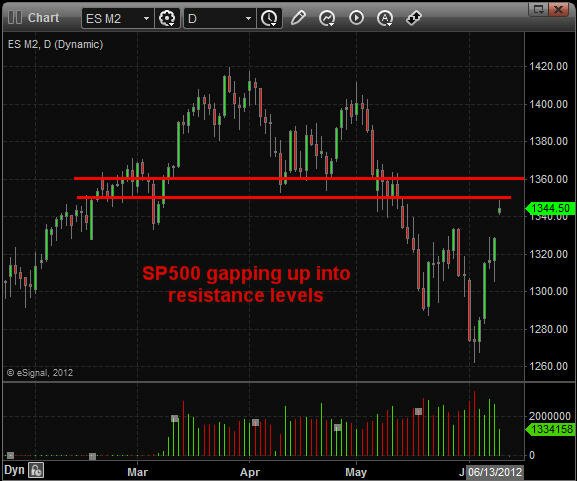
Major stock indexes and commodities will be trading at resistance at the open on Monday.
And the dollar which was hit hard in overnight trading Sunday is now trading at support. A bounce in the dollar and sellers stepping in at resistance could pull the market down for session or two.
The first 15 minutes of Monday’s session short sellers will be panicking out of their positions and getting stopped out. Once the dust starts to settle resistance and an oversold dollar may do their part and force the market lower later in the day.
Now if we add sentiment into this picture thinking of the masses covering their short positions in a big way we know from past events that when the masses all trade the same direction the market quickly reverses goes the opposite direction in the short term for 1-3 days.
So what does one do if they are short the market this week as I am in this boat?
Personally, I would wait 15-30 minutes to let things unfold and see what the price, volume and sentiment is doing. Keep in mind morning trends tend to stall out and roll over at 10am ET, or 11:30am ET. Knowing that; I will be watching price and volume to see if there is a bearish intraday pattern unfolding that looks as though it will unfold within those time frames. If so, I will hold my position and look for a reversal back down where I can exit at a lower price hopefully. But for all we know this news may just put the top market and we get much lower prices yet. Anyways, that is my plan as of Sunday night.
Stocks, Gold & Dollar Rising Together?
The recent few months I have been talking about how we could stocks, commodities and the dollar rise together. While is sounds crazy we just may start seeing that happen sooner than later. The Euro group appears to be willing to bailout the Spanish banks and that should cause the Euro lose more value and send the US dollar soaring.
Having more Euro liquidity is bullish for stocks and commodities along with the dollar. For all we know this just may be the financial storm for American’s next eggs (investments owned in Dollars) to rebound strongly over the next 12 months.
Follow Chris Vermeulen at the Traders Video Playbook com

Wednesday, June 6, 2012

Have Gold, Silver and Mining Stocks Bottomed?

Get our Free Trading Videos, Lessons and eBook today!

On Friday, the price action in gold caught the attention of most market participants as gold put in a monster move to the upside in light of risk assets such as the S&P 500 selling off sharply. In fact, gold futures rallied nearly $58 per troy ounce on Friday (+3.71%) while the S&P 500 Index sold off over 32 handles (-2.46%).

Monday saw some profit taking in gold and silver futures as Friday’s monster gains had to be digested. Short term traders were locking in profits, but overall the price action remains quite bullish at the moment. The gold miners remained extremely strong into the bell on Monday as buyers bid up prices in the afternoon to push them nearly 1.65% higher for the trading session.

Long time readers understand that I am a gold bull in the longer term and have been for quite some time. Unlike some gold bugs, I will discuss the downside in precious metals from time to time even though it generally fills up my email inbox with some rather rude and hate filled emails.

My view of gold and silver is that they are senior currencies. With that being said, I monitor the value of gold in U.S. Dollars and recognize that a stronger U.S. Dollar in the longer term is not necessarily bullish for gold. Yes both gold and the Dollar can rally together, but mutualistic price action generally does not last for long periods of time. Obviously I monitor the price action of the U.S. Dollar Index futures on a regular basis to help me gauge when the Dollar is at key turning points regarding.....Here is the entire article, charts and video.


30 Day Membership for only $1.00 at Traders Video Playbook.com

Monday, June 4, 2012

Monday Mathem Chart and Live Video Analysis

Get our Free Trading Videos, Lessons and eBook today!

This week should be just exciting with the markets reaching extreme levels for bonds, gold, SP500, and crude oil. This morning’s video covers it in detail.

Pre Market Analysis Points....

* US dollar index in consolidation and also forming a mini head and shoulders pattern which if the neckline is broken points to lower prices for the dollar that may last 1-2 sessions.

* Gold and silver are both trading at resistance levels and are headline driven at this point. Anything could happen going forward so I remain on the side for now.

* Crude oil continues to show weakness but is now trading within a major support level. I am keeping my eye on the intraday charts for a reversal pattern to play a bounce/rally this week.

* Bonds continue to rise with record low yields… This shows there is real panic fear in the market and lower prices may continue for another week or two.

* The volatility index while elevated is still overall trading low. This means more downside is possible investors and baby boomers start to roll more of their money out of stocks and into bonds.

* SP500 sold down another 1% in futures trading after the closing bell which was very bearish. This morning we have seen the dollar index pullback and that has allowed the SP500 to recover the 1% post market drop on Friday.....Read the entire article and watch todays video.


Sign up for our latest Video, Market Analysis and Forecast for the Dollar, Crude Oil, Gold, Silver, and the SP500

Friday, June 1, 2012

New Video: Detailed Commodities Analysis From Chris Vermeulen

Chris V. just completed a detailed video analysis of the U.S. dollar, gold, gold miners, silver, bonds, crude oil, natural gas, and the SP500 which is very timely and will help you navigate this market today and next week.

Just Click Here to watch todays Video!


Get our Free Trading Videos, Lessons and eBook today!