Showing posts with label Oil Newsletter. Show all posts

Sunday, April 18, 2010

Precious Metals & Oil ETF Trend Trading

Last week was exciting with broad market and gold forming an intraday reversal pattern after a long overbought rally, then broke down though short term key support levels. While this move lower was tough on the pocket book for those who chased the market up the past few days and/or were not moving their protective stops up, this move is good for the health of the market.

This pullback is actually a good thing for us active traders who wait for low risk setups and don’t chase prices higher, but rather buy on the dips in a bull market when most of the risk has been flushed out already. Trading with low risk setups is not the most exciting type of trading because there are not a ton of setups but if one can be patient and wait for these plays it is a very profitable strategy in the long run.

Those traders who live and breathe the market focusing on trading intraday price action most likely made a small fortune last week with Fridays sell off in stocks and precious metals. You can see how some of us took advantage of this sharp pullback last week with my before and after videos.

Below are the charts showing what I am currently thinking is going to happen for gold, silver, gold stocks and oil. I will be tracking the market with intraday charts to help pin point a low risk entry point for a possible short or long position as the market unfolds this week.

GLD – Gold Trading ETF

The chart below is an updated chart which I have showed several times. It shows how gold corrected, bottomed and is now trending back up. This week I will be watched closely to be sure we take a position which has the highest probability of working in our favor if and when a low risk setup occurs.


SLV – Silver Trading ETF

Silver really took a hit on Friday. It is now trading near support but there is not much we can do until we see what happens on Monday. There could be a bounce or more down side, tough to call right now…. And it’s not something you want to be on the wrong side of.


Gold Stocks – Gold Stock Trading

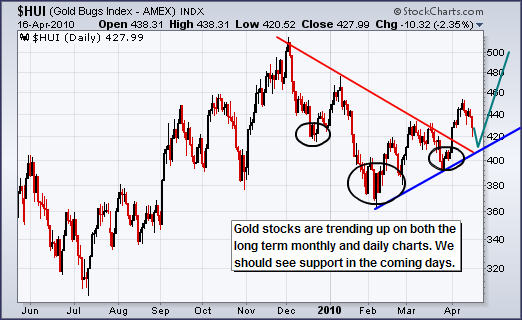
Gold stocks did not drop as much as I thought they would which indicates the market is still very bullish on gold. There is still potential for more downside… so I am letting the market unfold before doing anything.


USO – Oil Trading Fund

You can see oil moved down sharply on Friday and is now testing both a price support level and trendline support. Although this looks like a perfect setup, the market is designed to shake people out of positions before continuing the move. So it is likely for oil to dip which would break both these support levels triggering stop orders. Then the price should drop to the key support level where support should be found for at least a bounce or a new bottom.


Precious Metal & Oil ETF Trading Conclusion:

In short, the market had a nice correction on Friday and the heavy selling volume indicates that we are getting close to a larger correction which should provide two swing trades, a shorting opportunity and a new buying opportunity in the coming days, weeks or months depending how long the market takes with this pullback/correction.

Click here if you would like to receive Chris Vermeulen's ETF Trading Signals Newsletter.


Share

Thursday, February 4, 2010

Trends for Stocks & Commodities: Gold, Oil and Indexes

Stocks and metals have been on a steady rise this week. The US Dollar drifting lower has helped to add fuel to the oversold bounce in equities and metals we are seeing.

Stocks – NYSE 65 Minute Chart
Stocks have started to show signs of a possible reversal to the upside. So far this week we have seen the major indices form a higher high and as of today are stuck under the key resistance level shown on the chart below. The rally seen this week has been on light volume indicating there is not much strength behind it at this time.

If buying volume picks up and we see the NYSE break this resistance level then money should start to pour back into the market as the first set up of higher highs and lows will have formed and that is the definition of an up trend.


Gold – 24 Hour Trading Chart Using 8 Hour Bars
This chart allows us to look far enough back to see key support and resistance levels. Today we saw gold sell down with rising volume which is bearish.


Oil – 10 Hour Candle Chart
The Oil fund is currently in the same situation as gold. It had a nice rally/bounce which was expected from the rather large sell off over the past couple weeks.


US Dollar Index – 2 Hour Chart
This chart shows the dollar rally that triggered the recent sell off in gold & silver from Jan 25th to Jan 31st. So far in February, the dollar has drifted lower into a support level and bounced sharply on Wednesday. This is very bullish price action and points to higher dollar prices in the near future.


Stock & Commodity Trading Conclusion:
In short, stocks and metals rallied on light volume which is a sign of weakness. They are both stuck under a key resistance level and selling volume has started to pickup. To add more logs to the fire, the US Dollar appears to be picking up speed for another surge higher in the next couple days.

All of this leads me to believe this weeks rally is just a dead cat bounce and lower prices are just around the corner. But, because the 60 minute intraday charts have made a higher high, the down trend is now in question. When in doubt, just stay out. During possible tops or bottoms I find it best to stay clear of the market, even for day traders unless there are very strong price and volume surges occurring.

Just click here if you would like to receive these free trading reports from The Gold and Oil Guy Chris Vermeulen at The Gold and Oil Guy .Com


Share