Showing posts with label GDXJ. Show all posts

Thursday, February 7, 2019

Two Winning Trade Setups - GDXJ and ROKU

We are not always correct in our calls about the market. Professional researchers and analysts must understand that attempting to accurately predict the future outcome of any commodity, stock, index or ETF is impossible to be 100% accurate. Yet, we are pleased that our proprietary price modeling and analysis tools continue to provide us with very clear triggers and alert us to price moves before they happen.

Today, we are sharing two recent trades we executed with our members that resulted in some decent profits. The first example is our GDXJ trade. We had been in a Long position since before the beginning of 2019 expecting Gold and Miners to rally. Our price modeling systems suggested that after price reached $1300, we may experience a brief price pause over the next 45 days or so. Thus, we pulled the profits in this trade recently to lock in 10.5% profit and to allow us to re-enter when our modeling systems suggest the price pullback has ended.


The second example is our ROKU trade. We recently pulled 8.1% profit on a partial profit target execution for our members after a nice upside momentum move. This type of trade falls into our MRM (Momentum Reversal Method) trade trigger category and is supported by a momentum resurgence price move that can typically prompt prices to move +8~30% over fairly quick periods of time (under 20 days).


For almost all traders, we’ve found that understanding general market conditions, finding suitable trading triggers/setups and staying aware of the market dynamics at play in the global markets is very hard to accomplish. This is why we offer our members a very quick and easy way for them to accomplish all of these essential components for success with their membership to Technical Traders Ltd. Wealth Trading Newsletter.

  •  Our Daily Market Video, which is typically under 10 minutes in length, covers all of the major markets, most commodities, the US Dollar, Bitcoin and many other elements of the markets.


  • Combine this video content with our detailed market research posts, which you can read by visiting The Technical Traders Free Research, allows our members to not only learn from our video content but also to begin to understand and formulate their own conclusions based on our content.


  • Lastly, we add our trading trigger/alerts feature to alert our members to superior trading setups that we find while running our proprietary trading models. We don’t post 40 trades a day hoping our members will find one or two they can make profits from. We are highly selective in our posts and attempt to only post the best opportunities for success.

Over the past couple of months, we have been developing a new members area application. It will allow you to have live access to our morning spike and gap trades and traders chatroom, our SP500 index momentum, and swing trades, plus our special MRM (Momentum Reversal Method) stock picks on small/mid-cap stocks which also all trade options so if you want to you can trade options on your own around our stock trades.

Last week we made huge progress and this week’s goals are to implement the instant and automated SMS and email alerts sent to you every time there is a new trade, stop, target hit, or we close a position. This will give you more time to see and execute the trades as needed. Keep in mind most swing trades can be entered 1-3 days after the trade alert at the same price or better price simply because we are not that perfect at timing the markets every move.

If you take a minute to review these example REAL TRADES (above) and review the information at The Technical Traders, we believe you will understand the value and resources we offer our members. Isn’t it time you found the right team of professionals to help you make 2019 an incredibly successful year?

Chris Vermeulen


Tuesday, June 26, 2018

Why Gold Miners Should Rally as U.S. Equities Fall on Fear

The US Equities markets rotated over 1.35% lower on Monday, June 25, after a very eventful weekend full of news and global political concerns. Much of this fear results from unknowns resulting from Europe, Asia, China, Mexico and the US. Currently, there are so many “contagion factors” at play, we don’t know how all of it will eventually play out in the long run.

Europe is in the midst of a moderate political revolt regarding refugee/immigration issues/costs and political turmoil originating from the European Union leadership. How they resolve these issues will likely be counter to the populist demands from the people of Europe.

Asia is in the midst of a political and economic cycle rotation. Malaysia has recently elected Prime Minister Dr. Mahathir Mohamad, the 92 year old previous prime minister (1981-2003) as a populist revolt against the Najib Razak administration. In the process, Mahathir has opened new and old corruption and legal issues while attempting to clean up the corruption and nepotism that has run rampant in Malaysia. Most recently, Mahathir has begun to question the established relationship with Singapore and the high speed rail system that was proposed to link the two countries.

China is experiencing a host of issues at the moment. Trade concerns, capital market concerns, corporate debt concerns and an overall economic downturn cycle that started near the beginning of 2018. What will it take to push China over the edge in terms of a credit/consumer market crash is anyone’s guess? Our assumption is that continued inward and outward pressures will not abate quickly – so more unknowns exist.

Mexico will have new Presidential elections on July 1, 2018. What hangs in the balance of this election cycle is just about everything in terms of North American economic cooperation and future success. It is being reported that a populist “anti-neoliberal” movement is well underway in Mexico and the newly elected leader may begin a broader pushback against President Trump regarding NAFTA, immigration, US corporations operating in Mexico and more. We won’t know the full outcome of this election till well after July 2018.

Meanwhile, back in the USA, our political leaders in Congress and the House of Representatives seem hell bent on opposing everything President Trump and many Americans seem to want – clean up the mess in our government and get a handle on the pressing issues before us. The U.S. has a growing and robust economy. The last thing anyone wants right now is anything to disrupt this growth. Yet, it seems the political divide in the U.S. is so strong that it may take some crisis event to push any resolution forward.

What does this mean for investors and traders? Fear typically appears in one place before it appears anywhere else – the Metals markets (Gold, Silver, Platinum, and Palladium). This Daily Gold Chart shows our predictive cycle analysis pointing to a near term bottom formation as well as a strong likelihood of immediate upside price action. These cycles do not represent price levels. So the cycle peak does not represent where price will go – it simply indicates future cycle trends and direction.

Given this information, it is very likely that Gold will recover to near 1320 within the next couple weeks and possibly push higher on global concerns. For traders, this means we are sitting near an ultimate bottom in the metals and this could be an excellent buying opportunity.


The Gold Miners ETF shows a similar cycle pattern but notice how prices in the Miners ETF have diverged from the Gold chart, above, by not resorting to a new price low as deep as seen above. This could be interpreted as the Gold market reacting to global concerns in an exaggerated way while the miners ETF is showing a more muted reaction. Additionally, notice how the ADL cycle analysis is pointing to similar price peaks in the future with near term bottoms forming. This is key to understanding what we should be expecting over the next few weeks in Gold.


Our interpretation is that the global fear will manifest as a renewed upside trend in Gold and Gold Miners over the next few weeks with the potential for a 5 to 8% rally in Gold. The long term upside is incredible for these trades but that is if you look years into the future.

As these fear components and unknowns continue to evolve, the metals markets should find support and push higher as fear continues to manifest and global markets continue to weaken.

As we have been stating since the beginning of this year, 2018 is setting up to be a trader’s dream. Bigger volatility. Bigger swings. Bigger profits if you are on the right side of these moves. Our proprietary predictive modeling systems and price analysis tools help us to stay ahead of the markets.

We help our members understand the risks and navigate the future trends by issuing research posts, providing Daily video analysis complete with cycle projections and by delivering clear trading signals that assist all of our members in finding profits each year. We are showing you one of our proprietary tools right now, our ADL Predictive Cycle tool and what we believe will be the start of a potential upside move in the metals markets.

 Get ready for some great trading over the next few months!


Stock & ETF Trading Signals

Monday, March 9, 2015

Going Vertical.....Our Next Online Event

There are again signs on the horizon that the next gold bull market may not be far off.

On February 11, Bloomberg reported, “Gold producers with cash on hand are on the hunt for cheap mining assets as rising prices drive shares higher.” $2.7 billion in deals have already been announced or completed year to date—compared to a total of $10.5 billion in 2014.

Private equity firms (the “smart money”) are circling the mining industry for great deals. GDX, the Market Vectors Gold Miners ETF, currently has an aggregate price to book ratio of 1.06, while its little brother, the Market Vectors Junior Gold Miners ETF (GDXJ), trades at 76% of book value.

A stronger US dollar and falling oil prices are presenting two deflationary forces that are good for gold. The last two times oil dropped more than 50% in one year—1986 and 2008—gold rallied over 25% the following year.

Here's our video primer for this weeks event "Are you Going to Buy Low and Sell High this Time Around"

Investors are waking up to the fact that gold is rallying. Among the top 10 non leveraged ETFs are five gold miners ETFs. As of early February, investors had already poured $885.4 million in new assets into GDX—one of the best results among sector ETFs—and GDXJ attracted nearly $226 million.

No one can say for sure if this is the beginning of the next gold bull market. However, what is clear is that once the bull market does get started, the best of the best gold stocks will go vertical.

Successful gold producers may go up 150-200%. But the top ranked junior miners—the companies with quality management and great assets will take a moonshot. 500%, 1,000%, and more is not out of the question.

Casey Research’s free online event GOING VERTICAL aims to help investors understand where we are in the gold cycle, what to expect, and how to prepare their portfolio so they have a real shot at the jackpot when gold rises again.

Just Click Here to Reserve Your Spot

Eight industry stars discuss the most pressing issues of the day......

Pierre Lassonde, cofounder and chairman of Franco-Nevada
Rick Rule, founder and chairman of Sprott Global Resource Investments
Ron Netolitzky, chairman and director of Aben Resources
Doug Casey, chairman of Casey Research
Frank Holmes, CEO and CIO of U.S. Global Investors
Bob Quartermain, president, CEO, and director of Pretium Resources
and Casey Research precious metals experts Louis James and Jeff Clark.

Topics they will talk about in GOING VERTICAL include: 2015 outlook on the gold market; up, down, or sideways?—What to expect from gold’s next leg up, and how even stocks that have dropped 75% or more can come back with a vengeance—How to make money on junior miners even in the midst of a downturn—Which country may end up controlling the price of gold and what that means for investors—4 signs that a bear market is turning into a bull market—Which types of companies institutional investors will flock to first when gold goes up, and how to “front run” them—3 reasons why the best gold producers might double when the gold sector recovers—and much more.

Also, some of the experts talk about their favorite gold and silver companies, naming names—and Louis James reveals one of his favorite junior mining stock with vertical potential.

Register now to watch the event on Tuesday, March 10, 2:00 p.m. EDT. Even if you know you can’t make it at that time, register anyway that way you’ll get an email with a link to the video recording after the event and can watch it at your leisure.

Click Here to Learn More and Register

See you on Tuesday,
The Gold ETF Trader


Get our latest FREE eBook "Understanding Options"....Just Click Here!

Sunday, January 4, 2015

Weekly Gold Market Summary with Mike Seery

Gold futures in the February contract witnessed another extremely volatile trading session with another $20 trading range currently trading up $4 at 1,188 after trading as low as 1,167 earlier in the session as the U.S dollar hit another multiyear high pressuring many the commodity prices, however bottom feeders appeared thinking that gold was overdone to the downside.

Gold futures are trading below their 20 and 100 day moving average as I am currently sitting on the sidelines in this market waiting for better chart structure to develop as the market is just too volatile in my opinion, however if you are bearish this market I would sell at today’s price while placing my stop above the 10 day high which currently stands at 1,210 risking around $23 or $2,300 per contract plus slippage and commission as the chart structure is relatively solid at the current time.

Get our latest FREE eBook "Understanding Options"....Just Click Here!

Gold futures remain in a long term downtrend as investors are still putting money into the S&P 500 and out of the precious metals especially with a strong U.S dollar which looks to head higher in my opinion and with worldwide problems cooling down especially with Russia there’s really no reason to own gold at the current time.

Gold futures traded over the last 2 months in a price range between $1,140-$1,240 and now around mid-range so I’m waiting for a trend to develop as traders are waiting next Friday’s monthly unemployment report which should send even more volatility into this market so make sure if you are in the futures market that you use the proper amount contracts risking 2% of your account balance on any given trade as this market is high risk.
TREND: LOWER
CHART STRUCTURE: EXCELLENT


Get more of Mike Seerys calls on commodities this week.....Just Click Here

Saturday, December 20, 2014

Mike Seerys Weekly Gold Market Recap for Week Ending Friday December 19th

Gold futures in the February contract are trading below their 20 and 100 day moving average settling last Friday in New York at 1,222 currently trading at 1,196 continuing its long term bearish trend as I’m currently sitting on the sidelines in this market as volatility is too high and the price remains extremely choppy as we head into the new year.

Gold prices rallied as high as 1,240 last week before settling back despite the fact that the stock market had a wild ride but the interest still is in the S&P 500 which looks like it’s going to close right near another record high today. The problem with the gold market is the ETF market in gold might be sold come year end for tax purposes and when that happens the ETF than has to sell the futures contract so I still think lower prices are ahead but this market is difficult to trade at the current time so move on and find a market that is trending strong in one direction.

Get more commodity calls from our trading partner Mike Seery......Just Click Here

The U.S dollar hit another multiyear high which is generally pessimistic commodity prices and especially precious metals prices, however with turmoil in Russia gold prices have been extremely volatile with many $30/$40 price ranges on any given day so if you do trade this market make sure you place the proper amount contracts limiting risk to 2% of your account balance as I have to admit it’s fun to watch but I remain on the sidelines until a true breakout occurs.

Rumors of Russia having to sell some of their gold reserves sent gold prices down nearly down $30 in Wednesday’s trade however that rumor has not been verified at the current time but with the problems in Russia it would not surprise me about anything.
Trend: Mixed
Chart structure: Poor

Get out latest FREE eBooK "Understanding Options"....Just Click Here

Friday, August 8, 2014

The Single Most Important Strategy Most Investors Ignore

Jeff Clark, senior precious metals analyst for Casey Research, explains to skeptics why international diversification is so important.

The Single Most Important Strategy Most Investors Ignore

“If I scare you this morning, and as a result you take action, then I will have accomplished my goal.” That’s what I told the audience at the Sprott Natural Resource Symposium in Vancouver two weeks ago.

But the reality is that I didn’t need to try to scare anyone. The evidence is overwhelming and has already alarmed most investors; our greatest risk is not a bad investment but our political exposure.

And yet most of these same investors do not see any need to stash bullion outside their home countries. They view international diversification as an extreme move. Many don’t even care if capital controls are instituted.

I’m convinced that this is the most common—and important—strategic investment error made today. So let me share a few key points from my Sprott presentation and let you decide for yourself if you need to reconsider your own strategy. (Bolding for emphasis is mine.)

1: IMF Endorses Capital Controls

Bloomberg reported in December 2012 that the “IMF has endorsed the use of capital controls in certain circumstances.“

This is particularly important because the IMF, arguably an even more prominent institution since the global financial crisis started, has always had an official stance against capital controls. “In a reversal of its historic support for unrestricted flows of money across borders, the IMF said controls can be useful...”

Will individual governments jump on this bandwagon? “It will be tacitly endorsed by a lot of central banks,” says Boston University professor Kevin Gallagher. If so, it could be more than just your home government that will clamp down on storing assets elsewhere.

2: There Is Academic Support for Capital Controls

Many mainstream economists support capital controls. For example, famed Harvard Economists Carmen Reinhart and Ken Rogoff wrote the following earlier this year:

Governments should consider taking a more eclectic range of economic measures than have been the norm over the past generation or two. The policies put in place so far, such as budgetary austerity, are little match for the size of the problem, and may make things worse. Instead, governments should take stronger action, much as rich economies did in past crises.

Aside from the dangerously foolish idea that reining in excessive government spending is a bad thing, Reinhart and Rogoff are saying that even more massive government intervention should be pursued. This opens the door to all kinds of dubious actions on the part of politicians, including—to my point today—capital controls.

“Ms. Reinhart and Mr. Rogoff suggest debt write-downs and ‘financial repression’, meaning the use of a combination of moderate inflation and constraints on the flow of capital to reduce debt burdens.”

The Reinhart and Rogoff report basically signals to politicians that it’s not only acceptable but desirable to reduce their debts by restricting the flow of capital across borders. Such action would keep funds locked inside countries where said politicians can plunder them as they see fit.

3: Confiscation of Savings on the Rise

“So, what’s the big deal?” Some might think. “I live here, work here, shop here, spend here, and invest here. I don’t really need funds outside my country anyway!”

Well, it’s self-evident that putting all of one’s eggs in any single basket, no matter how safe and sound that basket may seem, is risky—extremely risky in today’s financial climate.

In addition, when it comes to capital controls, storing a little gold outside one’s home jurisdiction can help avoid one major calamity, a danger that is growing virtually everywhere in the world: the outright confiscation of people’s savings.

The IMF, in a report entitled “Taxing Times,” published in October of 2013, on page 49, states:

“The sharp deterioration of the public finances in many countries has revived interest in a capital levy—a one-off tax on private wealth—as an exceptional measure to restore debt sustainability.”

The problem is debt. And now countries with higher debt levels are seeking to justify a tax on the wealth of private citizens.

So, to skeptics regarding the value of international diversification, I would ask: Does the country you live in have a lot of debt? Is it unsustainable?

If debt levels are dangerously high, the IMF says your politicians could repay it by taking some of your wealth.

The following quote sent shivers down my spine…

The appeal is that such a task, if implemented before avoidance is possible and there is a belief that is will never be repeated, does not distort behavior, and may be seen by some as fair. The conditions for success are strong, but also need to be weighed against the risks of the alternatives, which include repudiating public debt or inflating it away.

The IMF has made it clear that invoking a levy on your assets would have to be done before you have time to make other arrangements. There will be no advance notice. It will be fast, cold, and cruel.

Notice also that one option is to simply inflate debt away. Given the amount of indebtedness in much of the world, inflation will certainly be part of the “solution,” with or without outright confiscation of your savings. (So make sure you own enough gold, and avoid government bonds like the plague.)

Further, the IMF has already studied how much the tax would have to be:

The tax rates needed to bring down public debt to pre-crisis levels are sizable: reducing debt ratios to 2007 levels would require, for a sample of 15 euro area countries, a tax rate of about 10% on households with a positive net worth.

Note that the criterion is not billionaire status, nor millionaire, nor even “comfortably well off.” The tax would apply to anyone with a positive net worth. And the 10% wealth-grab would, of course, be on top of regular income taxes, sales taxes, property taxes, etc.
4: We Like Pension Funds

Unfortunately, it’s not just savings. Carmen Reinhart (again) and M. Belén Sbrancia made the following suggestions in a 2011 paper:

Historically, periods of high indebtedness have been associated with a rising incidence of default or restructuring of public and private debts. A subtle type of debt restructuring takes the form of ‘financial repression.’ Financial repression includes directed lending to government by captive domestic audiences (such as pension funds), explicit or implicit caps on interest rates, regulation of cross-border capital movements, and (generally) a tighter connection between government and banks.

Yes, your retirement account is now a “captive domestic audience.” Are you ready to “lend” it to the government? “Directed” means “compulsory” in the above statement, and you may not have a choice if “regulation of cross-border capital movements”—capital controls—are instituted.

5: The Eurozone Sanctions Money-Grabs

Germany’s Bundesbank weighed in on this subject last January:

“Countries about to go bankrupt should draw on the private wealth of their citizens through a one-off capital levy before asking other states for help.”

The context here is that of Germans not wanting to have to pay for the mistakes of Italians, Greeks, Cypriots, or whatnot. Fair enough, but the “capital levy” prescription is still a confiscation of funds from individuals’ banks or brokerage accounts.

Here’s another statement that sent shivers down my spine:

A capital levy corresponds to the principle of national responsibility, according to which tax payers are responsible for their government’s obligations before solidarity of other states is required.

The central bank of the strongest economy in the European Union has explicitly stated that you are responsible for your country’s fiscal obligations—and would be even if you voted against them! No matter how financially reckless politicians have been, it is your duty to meet your country’s financial needs.

This view effectively nullifies all objections. It’s a clear warning.

And it’s not just the Germans. On February 12, 2014, Reuters reported on an EU commission document that states:
The savings of the European Union’s 500 million citizens could be used to fund long-term investments to boost the economy and help plug the gap left by banks since the financial crisis.

Reuters reported that the Commission plans to request a draft law, “to mobilize more personal pension savings for long-term financing.”

EU officials are explicitly telling us that the pensions and savings of its citizens are fair game to meet the union’s financial needs. If you live in Europe, the writing is on the wall.
Actually, it’s already under way… Reuters recently reported that Spain has

…introduced a blanket taxation rate of .03% on all bank account deposits, in a move aimed at… generating revenues for the country’s cash-strapped autonomous communities.

The regulation, which could bring around 400 million euros ($546 million) to the state coffers based on total deposits worth 1.4 trillion euros, had been tipped as a possible sweetener for the regions days after tough deficit limits for this year and next were set by the central government.

Some may counter that since Spain has relatively low tax rates and the bail-in rate is small, this development is no big deal. I disagree: it establishes the principle, sets the precedent, and opens the door for other countries to pursue similar policies.

6: Canada Jumps on the Confiscation Bandwagon

You may recall this text from last year’s budget in Canada:

“The Government proposes to implement a bail-in regime for systemically important banks.”

A bail-in is what they call it when a government takes depositors’ money to plug a bank’s financial holes—just as was done in Cyprus last year.

This regime will be designed to ensure that, in the unlikely event a systemically important bank depletes its capital, the bank can be recapitalized and returned to viability through the very rapid conversion of certain bank liabilities into regulatory capital.

What’s a “bank liability”? Your deposits. How quickly could they do such a thing? They just told us: fast enough that you won’t have time to react.

By the way, the Canadian bail-in was approved on a national level just one week after the final decision was made for the Cyprus bail-in.

7: FATCA

Have you considered why the Foreign Account Tax Compliance Act was passed into law? It was supposed to crack down on tax evaders and collect unpaid tax revenue. However, it’s estimated that it will only generate $8.7 billion over 10 years, which equates to 0.18% of the current budget deficit. And that’s based on rosy government projections.

FATCA was snuck into the HIRE Act of 2010, with little notice or discussion. Since the law will raise negligible revenue, I think something else must be going on here. If you ask me, it’s about control.

In my opinion, the goal of FATCA is to keep US savers trapped in US banks and in the US dollar, in case the US wants to implement a Cyprus-like bail-in. Given the debt load in the US and given statements made by government officials, this seems like a reasonable conclusion to draw.

This is why I think that the institution of capital controls is a “when” question, not an “if” one. The momentum is clearly gaining steam for some form of capital controls being instituted in the near future. If you don’t internationalize, you must accept the risk that your assets will be confiscated, taxed, regulated, and/or inflated away.

What to Expect Going Forward

  • First, any announcement will probably not use the words “capital controls.” It will be couched positively, for the “greater good,” and words like “patriotic duty” will likely feature prominently in mainstream press and government press releases. If you try to transfer assets outside your country, you could be branded as a traitor or an enemy of the state, even among some in your own social circles.
  • Controls will likely occur suddenly and with no warning. When did Cyprus implement their bail-in scheme? On a Friday night after banks were closed. By the way, prior to the bail-in, citizens were told the Cypriot banks had “government guarantees” and were “well-regulated.” Those assurances were nothing but a cruel joke when lightning-fast confiscation was enacted.
  • Restrictions could last a long time. While many capital controls have been lifted in Cyprus, money transfers outside the country still require approval from the Central Bank—over a year after the bail-in.
  • They’ll probably be retroactive. Actually, remove the word “probably.” Plenty of laws in response to prior financial crises have been enacted retroactively. Any new fiscal or monetary emergency would provide easy justification to do so again. If capital controls or savings confiscations were instituted later this year, for example, they would likely be retroactive to January 1. For those who have not yet taken action, it could already be too late.
  • Social environment will be chaotic. If capital controls are instituted, it will be because we’re in some kind of economic crisis, which implies the social atmosphere will be rocky and perhaps even dangerous. We shouldn’t be surprised to see riots, as there would be great uncertainty and fear. That’s dangerous in its own right, but it’s also not the kind of environment in which to begin making arrangements.
  • Ban vs. levy. Imposing capital controls is a risky move for a government to make; even the most reckless politicians understand this. That won’t stop them, but it could make them act more subtly. For instance, they might not impose actual bans on moving money across borders, but instead place a levy on doing so. Say, a 50% levy? That would “encourage” funds to remain inside a given country. Why not 100%? You could be permitted to transfer $10,000 outside the country—but if the fee for doing so is $10,000, few will do it. Such verbal games allow politicians to claim they have not enacted capital controls and yet achieve the same effect. There are plenty of historical examples of countries doing this very thing.
Keep in mind: Who will you complain to? If the government takes a portion of your assets, legally, who will you sue? You will have no recourse. And don’t expect anyone below your tax bracket to feel sorry for you.

No, once the door is closed, your wealth is trapped inside your country. It cannot move, escape, or flee. Capital controls allow politicians to do anything to your wealth they deem necessary.

Fortunately, you don’t have to be a target. Our Going Global report provides all the vital information you need to build a personal financial base outside your home country. It covers gold ownership and storage options, foreign bank accounts, currency diversification, foreign annuities, reporting requirements, and much more. It’s a complete A to Z guide on how to diversify internationally.

Discover what solutions are right for you—whether you’re a big investor or small, novice or veteran, many options are available. I encourage you to pursue what steps are most appropriate for you now, before the door is closed.Learn more here…

The article The Single Most Important Strategy Most Investors Ignore was originally published at caseyresearch.


Wednesday, July 23, 2014

The TRUTH about China’s Massive Gold Hoard

By Jeff Clark, Senior Precious Metals Analyst

I don’t want to say that mainstream analysts are stupid when it comes to China’s gold habits, but I did look up how to say that word in Chinese…..


One report claims, for example, that gold demand in China is down because the yuan has fallen and made the metal more expensive in the country. Sounds reasonable, and it has a grain of truth to it. But as you’ll see below, it completely misses the bigger picture, because it overlooks a major development with how the country now imports precious metals.

I’ve seen so many misleading headlines over the last couple months that I thought it time to correct some of the misconceptions. I’ll let you decide if mainstream North American analysts are stupid or not.

The basis for the misunderstanding starts with the fact that the Chinese think differently about gold. They view gold in the context of its role throughout history and dismiss the Western economist who arrogantly declares it an outdated relic. They buy in preparation for a new monetary order—not as a trade they hope earns them a profit.

Combine gold’s historical role with current events, and we would all do well to view our holdings in a slightly more “Chinese” light, one that will give us a more accurate indication of whether we have enough, of what purpose it will actually serve in our portfolio, and maybe even when we should sell (or not).

The horizon is full of flashing indicators that signal the Chinese view of gold is more prudent for what lies ahead. Gold will be less about “making money” and more about preparing for a new international monetary system that will come with historic consequences to our way of life.

With that context in mind, let’s contrast some recent Western headlines with what’s really happening on the ground in China. Consider the big picture message behind these developments and see how well your portfolio is geared for a “Chinese” future…

Gold Demand in China Is Falling

This headline comes from mainstream claims that China is buying less gold this year than last. The International Business Times cites a 30% drop in demand during the “Golden Week” holiday period in May. Many articles point to lower net imports through Hong Kong in the second quarter of the year. “The buying frenzy, triggered by a price slump last April, has not been repeated this year,” reports Kitco.

However, these articles overlook the fact that the Chinese government now accepts gold imports directly into Beijing.

In other words, some of the gold that normally went through Hong Kong is instead shipped to the capital. Bypassing the normal trade routes means these shipments are essentially done in secret. This makes the Western headline misleading at best, and at worst could lead investors to make incorrect decisions about gold’s future.

China may have made this move specifically so its import figures can’t be tracked. It allows Beijing to continue accumulating physical gold without the rest of us knowing the amounts. This move doesn’t imply demand is falling—just the opposite.

And don’t forget that China is already the largest gold producer in the world. It is now reported to have the second largest in-ground gold resource in the world. China does not export gold in any meaningful amount. So even if it were true that recorded imports are falling, it would not necessarily mean that Chinese demand has fallen, nor that China has stopped accumulating gold.

China Didn’t Announce an Increase in Reserves as Expected

A number of analysts (and gold bugs) expected China to announce an update on their gold reserves in April. That’s because it’s widely believed China reports every five years, and the last report was in April 2009. This is not only inaccurate, it misses a crucial point.

First, Beijing publicly reported their gold reserve amounts in the following years:
  • 500 tonnes at the end of 2001
  • 600 tonnes at the end of 2002
  • 1,054 tonnes in April 2009.
Prior to this, China didn’t report any change for over 20 years; it reported 395 tonnes from 1980 to 2001.
There is no five-year schedule. There is no schedule at all. They’ll report whenever they want, and—this is the crucial point—probably not until it is politically expedient to do so.

Depending on the amount, the news could be a major catalyst for the gold market. Why would the Chinese want to say anything that might drive gold prices upwards, if they are still buying?

Even with All Their Buying, China’s Gold Reserve Ratio Is Still Low

Almost every report you’ll read about gold reserves measures them in relation to their total reserves. The US, for example, has 73% of its reserves in gold, while China officially has just 1.3%. Even the World Gold Council reports it this way.

But this calculation is misleading. The U.S. has minimal foreign currency reserves—and China has over $4 trillion. The denominators are vastly different.

A more practical measure is to compare gold reserves to GDP. This would tell us how much gold would be available to support the economy in the event of a global currency crisis, a major reason for having foreign reserves in the first place and something Chinese leaders are clearly preparing for.

The following table shows the top six holders of gold in GDP terms. (Eurozone countries are combined into one.) Notice what happens to China’s gold to GDP ratio when their holdings move from the last reported 1,054-tonne figure to an estimated 4,500 tonnes (a reasonable figure based on import data).

Country Gold
(Tonnes)
Value US$ B
($1300 gold)
GDP US$ B
(2013)
Gold
Percent
of GDP
Eurozone* 10,786.3 $450.8 12,716.30 3.5%
US 8,133.5 $339.9 16,799.70 2.0%
China** 4,500.0 $188.1 9,181.38 2.0%
Russia 1,068.4 $44.7 2,118.01 2.1%
India 557.7 $23.3 1,870.65 1.2%
Japan 765.2 $32.0 4,901.53 0.7%
China 1,054.1 $44.1 9,181.38 0.5%
*including 503.2 tonnes held by ECB
**Projection
Sources: World Gold Council, IMF, Casey Research proprietary calculations


At 4,500 tonnes, the ratio shows China would be on par with the top gold holders in the world. In fact, they would hold more gold than every country except the U.S. (assuming the U.S. and EU have all the gold they say they have). This is probably a more realistic gauge of how they determine if they’re closing in on their goals.


This line of thinking assumes China’s leaders have a set goal for how much gold they want to accumulate, which may or may not be the case. My estimate of 4,500 tonnes of current gold reserves might be high, but it may also be much less than whatever may ultimately satisfy China’s ambitions. Sooner or later, though, they’ll tell us what they have, but as above, that will be when it works to China’s benefit.

The Gold Price Is Weak Because Chinese GDP Growth Is Slowing

Most mainstream analysts point to the slowing pace of China’s economic growth as one big reason the gold price hasn’t broken out of its trading range. China is the world’s largest gold consumer, so on the surface this would seem to make sense. But is there a direct connection between China’s GDP and the gold price?
Over the last six years, there has been a very slight inverse correlation (-0.07) between Chinese GDP and the gold price, meaning they act differently slightly more often than they act the same. Thus, the Western belief characterized above is inaccurate. The data signal that, if China’s economy were to slow, gold demand won’t necessarily decline.

The fact is that demand is projected to grow for reasons largely unrelated to whether their GDP ticks up or down. The World Gold Council estimates that China’s middle class is expected to grow by 200 million people, to 500 million, within six years. (The entire population of the U.S. is only 316 million.) They thus project that private sector demand for gold will increase 25% by 2017, due to rising incomes, bigger savings accounts, and continued rapid urbanization. (170 cities now have over one million inhabitants.) Throw in China’s deep seated cultural affinity for gold and a supportive government, and the overall trend for gold demand in China is up.

The Gold Price Is Determined at the Comex, Not in China

One lament from gold bugs is that the price of gold—regardless of how much people pay for physical metal around the world—is largely a function of what happens at the Comex in New York.

One reason this is true is that the West trades in gold derivatives, while the Shanghai Gold Exchange (SGE) primarily trades in physical metal. The Comex can thus have an outsized impact on the price, compared to the amount of metal physically changing hands. Further, volume at the SGE is thin, compared to the Comex.
But a shift is underway…..

In May, China approached foreign bullion banks and gold producers to participate in a global gold exchange in Shanghai, because as one analyst put it, “The world’s top producer and importer of the metal seeks greater influence over pricing.”

The invited bullion banks include HSBC, Standard Bank, Standard Chartered, Bank of Nova Scotia, and the Australia and New Zealand Banking Group (ANZ). They’ve also asked producing companies, foreign institutions, and private investors to participate.

The global trading platform was launched in the city’s “pilot free-trade zone,” which could eventually challenge the dominance of New York and London.

This is not a proposal; it is already underway.

Further, the enormous amount of bullion China continues to buy reduces trading volume in North America. The Chinese don’t sell, so that metal won’t come back into the market anytime soon, if ever. This concern has already been publicly voiced by some on Wall Street, which gives you an idea of how real this trend is.
There are other related events, but the point is that going forward, China will have increasing sway over the gold price (as will other countries: the Dubai Gold and Commodities Exchange is to begin a spot gold contract within three months).

And that’s a good thing, in our view.

Don’t Be Ridiculous; the US Dollar Isn’t Going to Collapse

In spite of all the warning signs, the US dollar is still the backbone of global trading. “It’s the go-to currency everywhere in the world,” say government economists. When a gold bug (or anyone else) claims the dollar is doomed, they laugh.

But who will get the last laugh?

You may have read about the historic energy deal recently made between Chinese President Xi Jinping and Russian President Vladimir Putin. Over the next 30 years, about $400 billion of natural gas from Siberia will be exported to China. Roughly 25% of China’s energy needs will be met by 2018 from this one deal. The construction project will be one of the largest in the world. The contract allows for further increases, and it opens Russian access to other Asian countries as well. This is big.

The twist is that transactions will not be in US dollars, but in yuan and rubles. This is a serious blow to the petrodollar.

While this is a major geopolitical shift, it is part of a larger trend already in motion:
  • President Jinping proposed a brand-new security system at the recent Asian Cooperation Conference that is to include all of Asia, along with Russia and Iran, and exclude the US and EU.
  • Gazprom has signed agreements with consumers to switch from dollars to euros for payments. The head of the company said that nine of ten consumers have agreed to switch to euros.
  • Putin told foreign journalists at the St. Petersburg International Economic Forum that “China and Russia will consider further steps to shift to the use of national currencies in bilateral transactions.” In fact,a yuan-ruble swap facility that excludes the greenback has already been set up.
  • Beijing and Moscow have created a joint ratings agency and are now “ready for transactions… in rubles and yuan,” said the Russian Finance Minister Anton Siluanov. Many Russian companies have already switched contracts to yuan, partly to escape Western sanctions.
  • Beijing already has in place numerous agreements with major trading partners, such as Brazil and the Eurozone, that bypass the dollar.
  • Brazil, Russia, India, China, and South Africa (the BRICS countries) announced last week that they are “seeking alternatives to the existing world order.” The five countries unveiled a $100 billion fund to fight financial crises, their version of the IMF. They will also launch a World Bank alternative, a new bank that will make loans for infrastructure projects across the developing world.
You don’t need a crystal ball to see the future for the US dollar; the trend is clearly moving against it. An increasing amount of global trade will be done in other currencies, including the yuan, which will steadily weaken the demand for dollars.

The shift will be chaotic at times. Transitions this big come with complications, and not one of them will be good for the dollar. And there will be consequences for every dollar based investment. U.S. dollar holders can only hope this process will be gradual. If it happens suddenly, all U.S. dollar based assets will suffer catastrophic consequences. In his new book, The Death of Money, Jim Rickards says he believes this is exactly what will happen.

The clearest result for all U.S. citizens will be high inflation, perhaps at runaway levels—and much higher gold prices.

Gold Is More Important than a Profit Statement

Only a deflationary bust could keep the gold price from going higher at some point. That is still entirely possible, yet even in that scenario, gold could “win” as most other assets crash. Otherwise, I’m convinced a mid-four-figure price of gold is in the cards.

But remember: It’s not about the price. It’s about the role gold will serve protecting wealth during a major currency upheaval that will severely impact everyone’s finances, investments, and standard of living.
Most advisors who look out to the horizon and see the same future China sees believe you should hold 20% of your investable assets in physical gold bullion. I agree. Anything less will probably not provide the kind of asset and lifestyle protection you’ll need.

In the meantime, don’t worry about the gold price. China’s got your back.

You don’t have to worry about silver, either, which we think holds even greater potential for investors. In the July issue of my newsletter, BIG GOLD, we show why we’re so bullish on gold’s little cousin.

And we provide two silver bullion discounts exclusively for subscribers, and name our top silver pick of the year.

Of course, we also have all our best buys in the gold mining sector as well.

Click here to get it all with a 90 day risk free trial to our inexpensive BIG GOLD newsletter

The article The TRUTH about China’s Massive Gold Hoard was originally published at Casey Research


Get your free trend analysis for the junior miners ETF - GDXJ....Just Click Here!

Sunday, April 6, 2014

The Odds Are In Your Favor To Trade Gold This Quarter

Using MarketClub's weekly and daily Trade Triangles, I have found that over the last 6 1/2 years, the second quarter of the year has shown the most consistent profits in gold. These past results showed a quarterly gain on average of $7,104.83 on one futures contract.

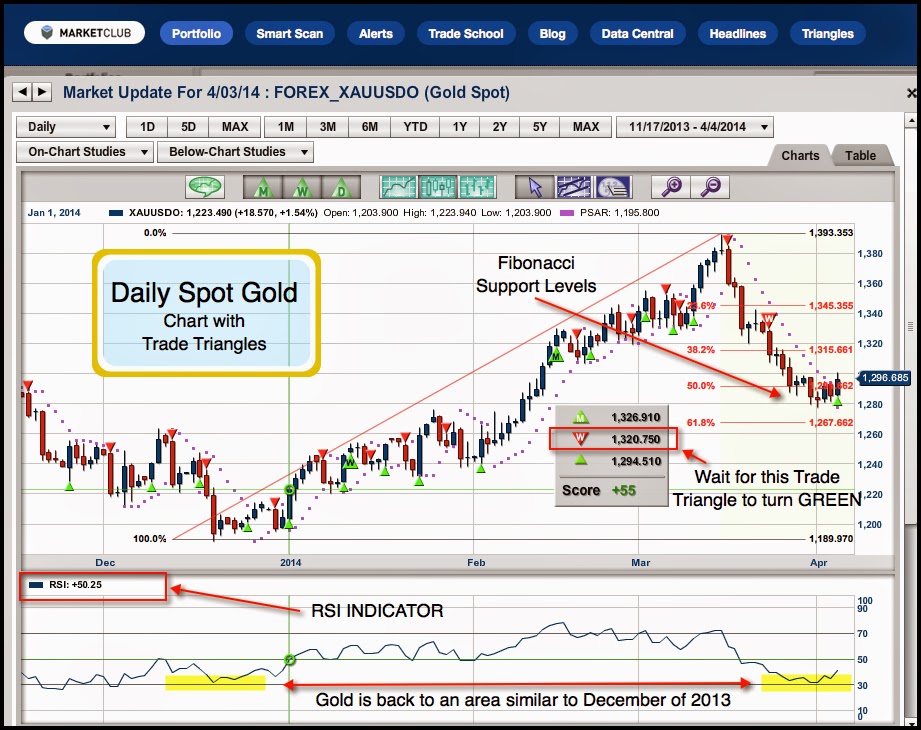
Gold (XAUUSDO) enjoyed a nice move up earlier in the year, reaching a high of $1393.35 and has pulled back to an important Fibonacci support area. I want to watch this market very carefully and wait for the weekly Trade Triangle to turn green to get bullish on gold. That's not to say I am not longer term bullish, it only means that my timing will kick in when the weekly Trade Triangle turns into a green Trade Triangle.


Besides the Fibonacci support area, the RSI indicator is also at a very low level, similar to that of December 2013.

Trading Results

Q2 of 2008            $965.00
Q2 of 2009            $870.00
Q2 of 2010         $7,057.00
Q2 of 2011         $6,700.00
Q2 of 2012         $4,223.00
Q2 of 2013       $31,260.00
TOTAL             $42,629.00
AVE GAIN         $7,104.83

The results are based on signals using MarketClub's real time spot gold prices and margin of $8,333. This particular trading strategy and results are based on trading one futures contract, both from the long and short side. An ETF could be substituted, but I suspect the results would be quite different.

Trading Rules

How to use MarketClub's Trade Triangles to trade gold:

Use the weekly Trade Triangle to determine the major trend and initial positions. Use the daily Trade Triangles for timing purposes.

Gold entry and exit signals are generated from the spot Gold (XAUUSDO) chart.

Let me give you an example: if the last weekly Trade Triangle is GREEN, this indicates that the major trend is up for that market. You would use the initial GREEN weekly Trade Triangle as an entry point. You would then use the next RED daily Trade Triangle as an exit point. You would only reenter a long position if and when a GREEN daily Trade Triangle kicked in.

You would then use the next RED daily Trade Triangle as an exit point, provided that the GREEN weekly Trade Triangle is still in place and the trend is positive for that market. The reverse is true when you have a RED weekly Trade Triangle. You would use the initial RED weekly Trade Triangle as an entry point for a short position. You would then use the next GREEN daily Trade Triangle as an exit point.

Only Trade With Risk Capital

Even if the odds are in your favor, don't forget that there are no guarantees in trading and only funds that you can afford to lose should be used to trade with.

See you in the markets!
Adam Hewison

Make sure to catch Adam on INO TV


Sign up for one of our Free Trading Webinars....Just Click Here!


Monday, March 24, 2014

Why Junior Gold Mining Stocks Are Our Favorite Speculations

By Laurynas Vegys, Research Analyst

Despite last week’s pullback, the precious metals market is off to an impressive start in 2014. Gold is up 10.6%, silver 4.3%, and the PHLX Gold/Silver (XAU) 17.1%. Gold, in particular, had a great February, rising above $1,300 for the first time since November 7, 2013. This has led to some very handsome gains in our Casey International Speculator portfolio, with a few of our recommendations already logging triple digit gains from their recent bottoms.

Why Junior Gold Mining Stocks Are Our Favorite Speculations


One of Doug Casey’s mantras is that one should buy gold for prudence, and gold stocks for profit. These are very different kinds of asset deployment. In other words, don’t think of gold as an investment, but as wealth protection. It’s the only highly liquid financial asset that is not simultaneously someone else’s obligation; it’s value you can liquidate and use to secure your needs. Possessing it is prudent.

Gold stocks are for speculation because they offer leverage to gold. This is actually true of all mining stocks, but the phenomenon is especially strong in the highly volatile precious metals. Most typical “be happy you beat inflation” returns simply can’t hold a candle to stocks that achieved 10 bagger status (1,000% gains). In previous bubbles—some even generated 100 fold returns. And we may see such returns again.

It’s Not Too Late to Make a Fortune

Here’s a look at our top three year to date gainers.


What’s especially remarkable is that all three of these stocks shot up much more than gold itself, on essentially no company specific news. This is dramatic proof of just how much leverage the right mining stocks can offer to movements in the underlying commodity—gold, in this case. Two of the stocks above are on our list of potential 10 baggers, by the way.

So have you missed the boat? Is it too late to buy?


Looking at the chart, two bullish factors jump out immediately:
  • Gold stocks have just now started to move up from a similar level in 2008.
  • Gold stocks remain severely undervalued compared to the gold price. A simple reversion to the mean implies a tremendous upside move.
Now consider the following data that point to a positive shift in the gold market.
  1. After 13 consecutive months of decline, GLD holdings were up over 10.5 tonnes last month. The trend is similar to other ETFs.
  1. Hedge funds and other large speculators more than doubled their bets on higher gold prices this year.
  1. Increase in M&A—for example, hostile bids from Osisko and HudBay Minerals to buy big assets.
  1. Apollo, KKR, and other large private equity groups have emerged as a new class of participants in the sector.
  1. Gold companies’ hedging of future production—usually a sign of insecurity among the miners—shrunk to the lowest level in 11 years.
  1. China continues to consume record amounts of gold and officially overtook India as the world’s largest buyer of gold in 2013.
  1. Large players in the gold futures market that were short have switched to being long.
  1. Central banks continue to be net buyers.
To top it off, there’s been no fallout (yet) from the unprecedented currency dilution undertaken since 2008—and we don’t believe in free lunches. The gold mania train has not yet left the station, but the engine is running and the conductor has the whistle in his mouth. This means…..

Any correction ahead is a potential last-chance buying opportunity before the final mania phase of this bull cycle takes our stock to new highs, well above previous interim peaks.

In spite of the good start to 2014, most of our 10 bagger gold stocks are still on the deep discount rack. And you can get all of them with a risk free, 3 month trial subscription to our monthly advisory focused on junior mining stocks, the Casey International Speculator.

If you sign up today, you can still get instant access to two special reports detailing which stocks are most likely to gain big this year: Louis James’ 10 Bagger List for 2014 and 7 Must Own Stocks for 2014.
Test drive the International Speculator for 3 months with a full money back guarantee, and if it’s not everything you expected, just cancel for a prompt, courteous refund of every penny you paid.

Click Here to Get Started Now

I hope you will take advantage of this opportunity in front of us—while shares are still relatively cheap.
The article Junior Mining Stocks to Beat Previous Highs was originally published at Casey Research


Get in on Thursdays FREE webinar before it's to late...."How To Trade Options – The Complete Roadmap"


Thursday, March 13, 2014

Which Month is the Best for Buying Gold?

By Jeff Clark, Senior Precious Metals Analyst

Many investors, especially those new to precious metals, don't know that gold is seasonal. For a variety of reasons, notably including the wedding season in India, the price of gold fluctuates in fairly consistent ways over the course of the year.


This pattern is borne out by decades of data, and hence has obvious implications for gold investors. Can you guess which is the best month for buying gold?

When I first entertained this question, I guessed June, thinking it would be a summer month when the price would be at its weakest. Finding I was wrong, I immediately guessed July. Wrong again, I was sure it would be August. Nope.

Cutting to the chase, here are gold’s average monthly gain and loss figures, based on almost 40 years of data:


Since 1975—the first year gold ownership in the U.S. was made legal again—March has been, on average, the worst performing month for gold. This, of course, makes March the best month for buying gold.

But: averages across such long time frames can mask all sorts of variations in the overall pattern. For instance, the price of gold behaves differently in bull markets, bear markets, flat markets… and manias.
So I took a look at the monthly averages during each of those market conditions. Here’s what I found.


Key point:

The only month gold has been down in every market condition is March.

Combined with the fact that gold soared 10.2% the first two months of this year, the odds favor a pullback this month.

And as above, that can be a very good thing. Here’s what buying in March has meant to past investors. We measured how well gold performed by December in each period if you bought during the weak month of March.


Only the bear market from 1981 to 2000 provided a negligible (but still positive) return by year’s end for investors who bought in March. All other periods put gold holders nicely in the black by New Year’s Eve.
If you’re currently bullish on precious metals, you might want to consider what the data say gold bought this month will be worth by year’s end.

Regardless of whether gold follows the monthly trend in March, the point is to buy during the next downdraft, whenever it occurs, for maximum profit. And keep your eye on the big picture: gold’s fundamentals signal the price has a long climb yet ahead.

Everyone should own gold bullion as a hedge against inflation and other economic maladjustments… and gold stocks for speculation and leveraged gains. The greatest gains, of course, come from the most volatile stocks on earth, the junior mining sector.

Following our recent Upturn Millionaires video event with eight top resource experts and investment pros, my colleague Louis James released his 10-Bagger List for 2014—a timely special report on the nine stocks most likely to gain 1,000% or more this year. Click here to find out more.

The article Gold Is Seasonal: When Is the Best Month to Buy? was originally published at Casey Research.


Don't miss a single one of our FREE Trading Webinars


Monday, March 10, 2014

What 10 Baggers (and 100 Baggers) Look Like

By Jeff Clark, Senior Precious Metals Analyst

Now that it appears clear the bottom is in for gold, it’s time to stop fretting about how low prices will drop and how long the correction will last—and start looking at how high they’ll go and when they’ll get there. When viewing the gold market from a historical perspective, one thing that’s clear is that the junior mining stocks tend to fluctuate between extreme boom and bust cycles. As a group, they’ll double in price, then crash by 75%..... then double or triple or even quadruple again, only to crash 90%. Boom, bust, repeat.

Given that we just completed a major bust cycle—and not just any bust cycle, but one of the harshest on record, according to many veteran insiders—the setup for a major rally in gold stocks is right in front of us.

This may sound sensationalistic, but based on past historical patterns and where we think gold prices are headed, the odds are high that, on average, gold producers will trade in the $200 per share range before the next cycle is over. With most of them currently trading between $20 and $40, the returns could be stupendous. And the percentage returns of the typical junior will be greater by an order of magnitude, providing life changing gains to smart investors.

What you’re about to see are historical returns of both producers and juniors during three separate boom cycles. These are factual returns; they are not hypothetical. And if you accept the fact that this market moves in cycles, you know it’s about to happen again.

Gold had a spectacular climb in 1979-1980, and gold stocks in general gave a staggering performance at that time—many of them becoming 10-baggers (1,000% gains and more). While this is a well known fact, few researchers have bothered to identify exact returns from specific companies during this era.

Digging up hard data from before the mid-1980s, especially for the junior explorers, is difficult because the information wasn’t computerized at the time. So I sent my nephew Grant to the library to view the Wall Street Journal on microfiche. We also include information we’ve had from Scott Hunter of Haywood Securities; Larry Page, then-president of the Manex Resource Group; and the dusty archives at the Northern Miner.

Note: This means our tables, while accurate, are not at all comprehensive.

Let’s get started…...

The Quintessential Bull Market: 1979-1980

The granddaddy of gold bull cycles occurred during the 1970s, culminating in an unabashed mania in 1979 and 1980. Gold peaked at $850 an ounce on January 21, 1980, a rise of 276% from the beginning of 1979. (Yes, the price of gold on the last trading day of 1978 was a mere $226 an ounce.)

Here’s a sampling of gold producer stock prices from this era. What you’ll notice in addition to the amazing returns is that gold stocks didn’t peak until nine months after gold did.

Returns of Producers in 1979-1980 Mania
Company Price on
12/29/1978
Sept. 1980
Peak
Return
Campbell Lake Mines $28.25 $94.75 235.4%
Dome Mines $78.25 $154.00 96.8%
Hecla Mining $5.12 $53.00 935.2%
Homestake Mining $30.00 $107.50 258.3%
Newmont Mining $21.50 $60.62 182.0%
Dickinson Mines $6.88 $27.50 299.7%
Sigma Mines $36.00 $57.00 58.3%
Giant Yellowknife Mines $11.13 $39.00 250.4%
AVERAGE 289.5%

Today, GDX is selling for $26.05 (as of February 26, 2014); if it mimicked the average 289.5% return, the price would reach $101.46.

Keep in mind, though, that our data measures the exact top of each company’s price. Most investors, of course, don’t sell at the very peak. If we were to able to grab, say, 80% of the climb, that’s still a return of 231.6%.

Here’s a sampling of how some successful junior gold stocks performed in the same period, along with the month each of them peaked.

Returns of Juniors in 1979-1980 Mania
Company Price on
12/29/1978
Price
Peak
Date
of Peak
Return
Carolin Mines $3.10 $57.00 Oct. 80 1,738.7%
Mosquito Creek Gold $0.70 $7.50 Oct. 80 971.4%
Northair Mines $3.00 $10.00 Oct. 80 233.3%
Silver Standard $0.58 $2.51 Mar. 80 332.8%
Lincoln Resources $0.78 $20.00 Oct. 80 2,464.1%
Lornex $15.00 $85.00 Oct. 80 466.7%
Imperial Metals $0.36 $1.95 Mar. 80 441.7%
Anglo-Bomarc Mines $1.80 $6.85 Oct. 80 280.6%
Avino Mines 0.33 5.5 Dec. 80 1,566.7%
Copper Lake $0.08 $10.50 Sep. 80 13,025.0%
David Minerals $1.15 $21.00 Oct. 80 1,726.1%
Eagle River Mines $0.19 $6.80 Dec. 80 3,478.9%
Meston Lake Resources $0.80 $10.50 Oct. 80 1,212.5%
Silverado Mines $0.26 $10.63 Oct. 80 3,988.5%
Wharf Resources $0.33 $9.50 Nov. 80 2,778.8%
AVERAGE 2,313.7%


If you had bought a reasonably diversified portfolio of top-performing gold juniors prior to 1979, your initial investment could have grown 23 times in just two years. If you had managed to grab 80% of that move, your gains would still have been over 1,850%.

This means a junior priced at $0.50 today that captured the average gain from this boom would sell for $12 at the top, or $9.75 at 80%. If you own ten juniors, imagine just one of them matching Copper Lake’s better than 100-bagger performance.

Here’s what returns of this magnitude could mean to you. Let’s say your portfolio includes $10,000 in gold juniors that yield spectacular gains such as the above. If the next boom cycle matches the 1979-1980 pattern, your portfolio could be worth $241,370 at its peak… or about $195,000 if you exit at 80% of the top prices.

Note that this does require that you sell to realize your profits. If you don’t take the money and run at some point, you may end up with little more than tears to fill an empty beer mug. In the subsequent bust cycle, many junior gold stocks, including some in the above list, dried up and blew away. Investors who held on to the bitter end not only saw all their gains evaporate, but lost their entire investments.
You have to play the cycle.

Returns from that era have been written about before, so I can hear some investors saying, “Yeah, but that only happened once.”

Au contraire. Read on…...

The Hemlo Rally of 1981-1983

Many investors don’t know that there have been several bull cycles in gold and gold stocks since the 1979-1980 period.

Ironically, gold was flat during the two years of the Hemlo rally. But something else ignited a bull market. Discovery. Here’s how it happened…...

Back in the day, most exploration was done by teams from the major producers. But because of lagging gold prices and the resulting need to cut overhead, they began to slash their exploration budgets, unleashing a swarm of experienced geologists armed with the knowledge of high potential mineral targets they’d explored while working for the majors. Many formed their own companies and went after these targets.

This led to a series of spectacular discoveries, the first of which occurred in mid 1982, when Golden Sceptre and Goliath Gold discovered the Golden Giant deposit in the Hemlo area of eastern Canada. Gold prices rallied that summer, setting off a mini bull market that lasted until the following May. The public got involved, and as you can see, the results were impressive for such a short period of time.

Returns of Producers Related to Hemlo Rally of 1981-1983
Company 1981
Price
Price
Peak
Date
of High
Return
Agnico-Eagle $9.50 $21.00 Aug. 83 121.1%
Sigma $14.13 $24.50 Jan. 83 73.4%
Campbell Red Lake $16.63 $41.25 May 83 148.0%
Sullivan $3.85 $6.00 Mar. 84 55.8%
Teck Corp Class B $17.00 $21.88 Jun. 81 28.7%
Noranda $33.75 $36.38 Jun. 81 7.8%
AVERAGE 72.5%

Gold producers, on average, returned over 70% on investors’ money during this period. While these aren’t the same spectacular gains from just a few years earlier, keep in mind they occurred over only about 12 months’ time. This would be akin to a $20 gold stock soaring to $34.50 by this time next year, just because it’s located in a significant discovery area.

Once again, it was the juniors that brought the dazzling returns.

Returns of Juniors Related to Hemlo Rally of 1981-1983
Company 1981
Price
Price
Peak
Date
of High
Return
Corona Resources $1.10 $61.00 May 83 5,445.5%
Golden Sceptre $0.40 $31.00 May 83 7,650.0%
Goliath Gold $0.45 $32.00 Mar 83 7,011.1%
Bel-Air Resources $0.81 $1.60 Jan. 83 97.5%
Interlake Development $2.10 $6.40 Mar. 83 204.8%
AVERAGE 4,081.8%

The average return for these junior gold stocks that had a direct interest in the Hemlo area exceeded a whopping 4,000%.

This is especially impressive when you realize that it occurred without the gold stock industry as a whole participating. This tells us that a big discovery can lead to enormous gains, even if the industry as a whole is flat.

In other words, we have historical precedence that humongous returns are possible without a mania, by owning stocks with direct exposure to a discovery area. There are numerous examples of this in the past ten years, as any longtime reader of the International Speculator can attest.

By May 1983, roughly a year after it started, gold prices started back down again, spelling the end of that cycle—another reminder that one must sell to realize a profit.

The Roaring ’90s

By the time the ’90s rolled around, many junior exploration companies had acquired the “intellectual capital” they needed from the majors. Another series of gold discoveries in the mid-1990s set off one of the most stunning bull markets in the current generation.

Companies with big discoveries included Diamet, Diamond Fields, and Arequipa. This was also the time of the famous Bre-X scandal, a company that appeared to have made a stupendous discovery, but that was later found to have been “salting” its drill data (cheating).

By the summer of ’96, these discoveries had sparked another bull cycle, and companies with little more than a few drill holes were selling for $20 a share.

The table below, which includes some of the better-known names of the day, is worth the proverbial thousand words. The average producer more than tripled investors’ money during this period. Once again, these gains occurred in a relatively short period of time, in this case inside of two years.

Returns of Producers in Mid-1990s Bull Market
Company Pre-Bull
Market Price
Price
Peak
Date
of High
Return
Kinross Gold $5.00 $14.62 Feb. 96 192.4%
American Barrick $28.13 $44.25 Feb. 96 57.3%
Placer Dome $26.50 $41.37 Feb. 96 56.1%
Newmont $47.26 $82.46 Feb. 96 74.5%
Manhattan $1.50 $13.00 Nov. 96 766.7%
Cambior $10.00 $22.35 Jun. 96 123.5%
AVERAGE 211.7%

Here’s how some of the juniors performed. And if you’re the kind of investor with the courage to buy low and the discipline to sell during a frenzy, it can be worth a million dollars. Hold on to your hat.

Returns of Juniors in Mid-1990s Bull Market
Company Pre-Bull
Market Price
Price
Peak
Date
of High
Return
Cartaway $0.10 $26.14 May 96 26,040.0%
Golden Star $6.00 $27.50 Oct. 96 358.3%
Samex Mining $1.00 $7.20 May 96 620.0%
Pacific Amber $0.21 $9.40 Aug. 96 4,376.2%
Conquistador $0.50 $9.87 Mar. 96 1,874.0%
Corriente $1.00 $19.50 Mar. 97 1,850.0%
Valerie Gold $1.50 $28.90 May 96 1,826.7%
Arequipa $0.60 $34.75 May 96 5,691.7%
Bema Gold $2.00 $12.75 Aug. 96 537.5%
Farallon $0.80 $20.25 May 96 2,431.3%
Arizona Star $0.50 $15.95 Aug. 96 3,090.0%
Cream Minerals $0.30 $9.45 May 96 3,050.0%
Francisco Gold $1.00 $34.50 Mar. 97 3,350.0%
Mansfield $0.70 $10.50 Aug. 96 1,400.0%
Oliver Gold $0.40 $6.80 Oct. 96 1,600.0%
AVERAGE 3,873.0%

Many analysts refer to the 1970s bull market as the granddaddy of them all—and to a certain extent it was—but you’ll notice that the average return of these stocks during the late ’90s bull exceeds what the juniors did in the 1979-1980 boom.

This is akin to that $0.50 junior stock today reaching $19.86… or $16, if you snag 80% of the move. A $10,000 portfolio with similar returns would grow to over $397,000 (or over $319,000 on 80%).

Gold Stocks and Depression

Those of you in the deflation camp may dismiss all this because you’re convinced the Great Deflation is ahead. Fair enough. But you’d be wrong to assume gold stocks can’t do well in that environment.

Take a look at the returns of the two largest producers in the U.S. and Canada, respectively, during the Great Depression of the 1930s, a period that saw significant price deflation.

Returns of Producers
During the Great Depression
Company 1929
Price
1933
Price
Total
Gain
Homestake Mining $65 $373 474%
Dome Mines $6 $39.50 558%

During a period of soup lines, crashing stock markets, and a fixed gold price, large gold producers handed investors five and six times their money in four years. If deflation “wins,” we still think gold equity investors can, too.

How to Capitalize on This Cycle

History shows that precious metals stocks move in cycles. We’ve now completed a major bust cycle and, we believe, are on the cusp of a tremendous boom. The only way to make the kind of money outlined above is to buy before the boom is in full swing. That’s now. For most readers, this is literally a once in a lifetime opportunity.

As you can see above, there can be great variation among the returns of the companies. That’s why, even if you believe we’re destined for an “all boats rise” scenario, you still want to own the better companies.

My colleague Louis James, Casey’s chief metals and mining investment strategist, has identified the nine junior mining stocks that are most likely to become 10 baggers this year in their special report, the 10-Bagger List for 2014. Read more here.


The article What 10-Baggers (and 100-Baggers) Look Like was originally published at Casey Research.